
|
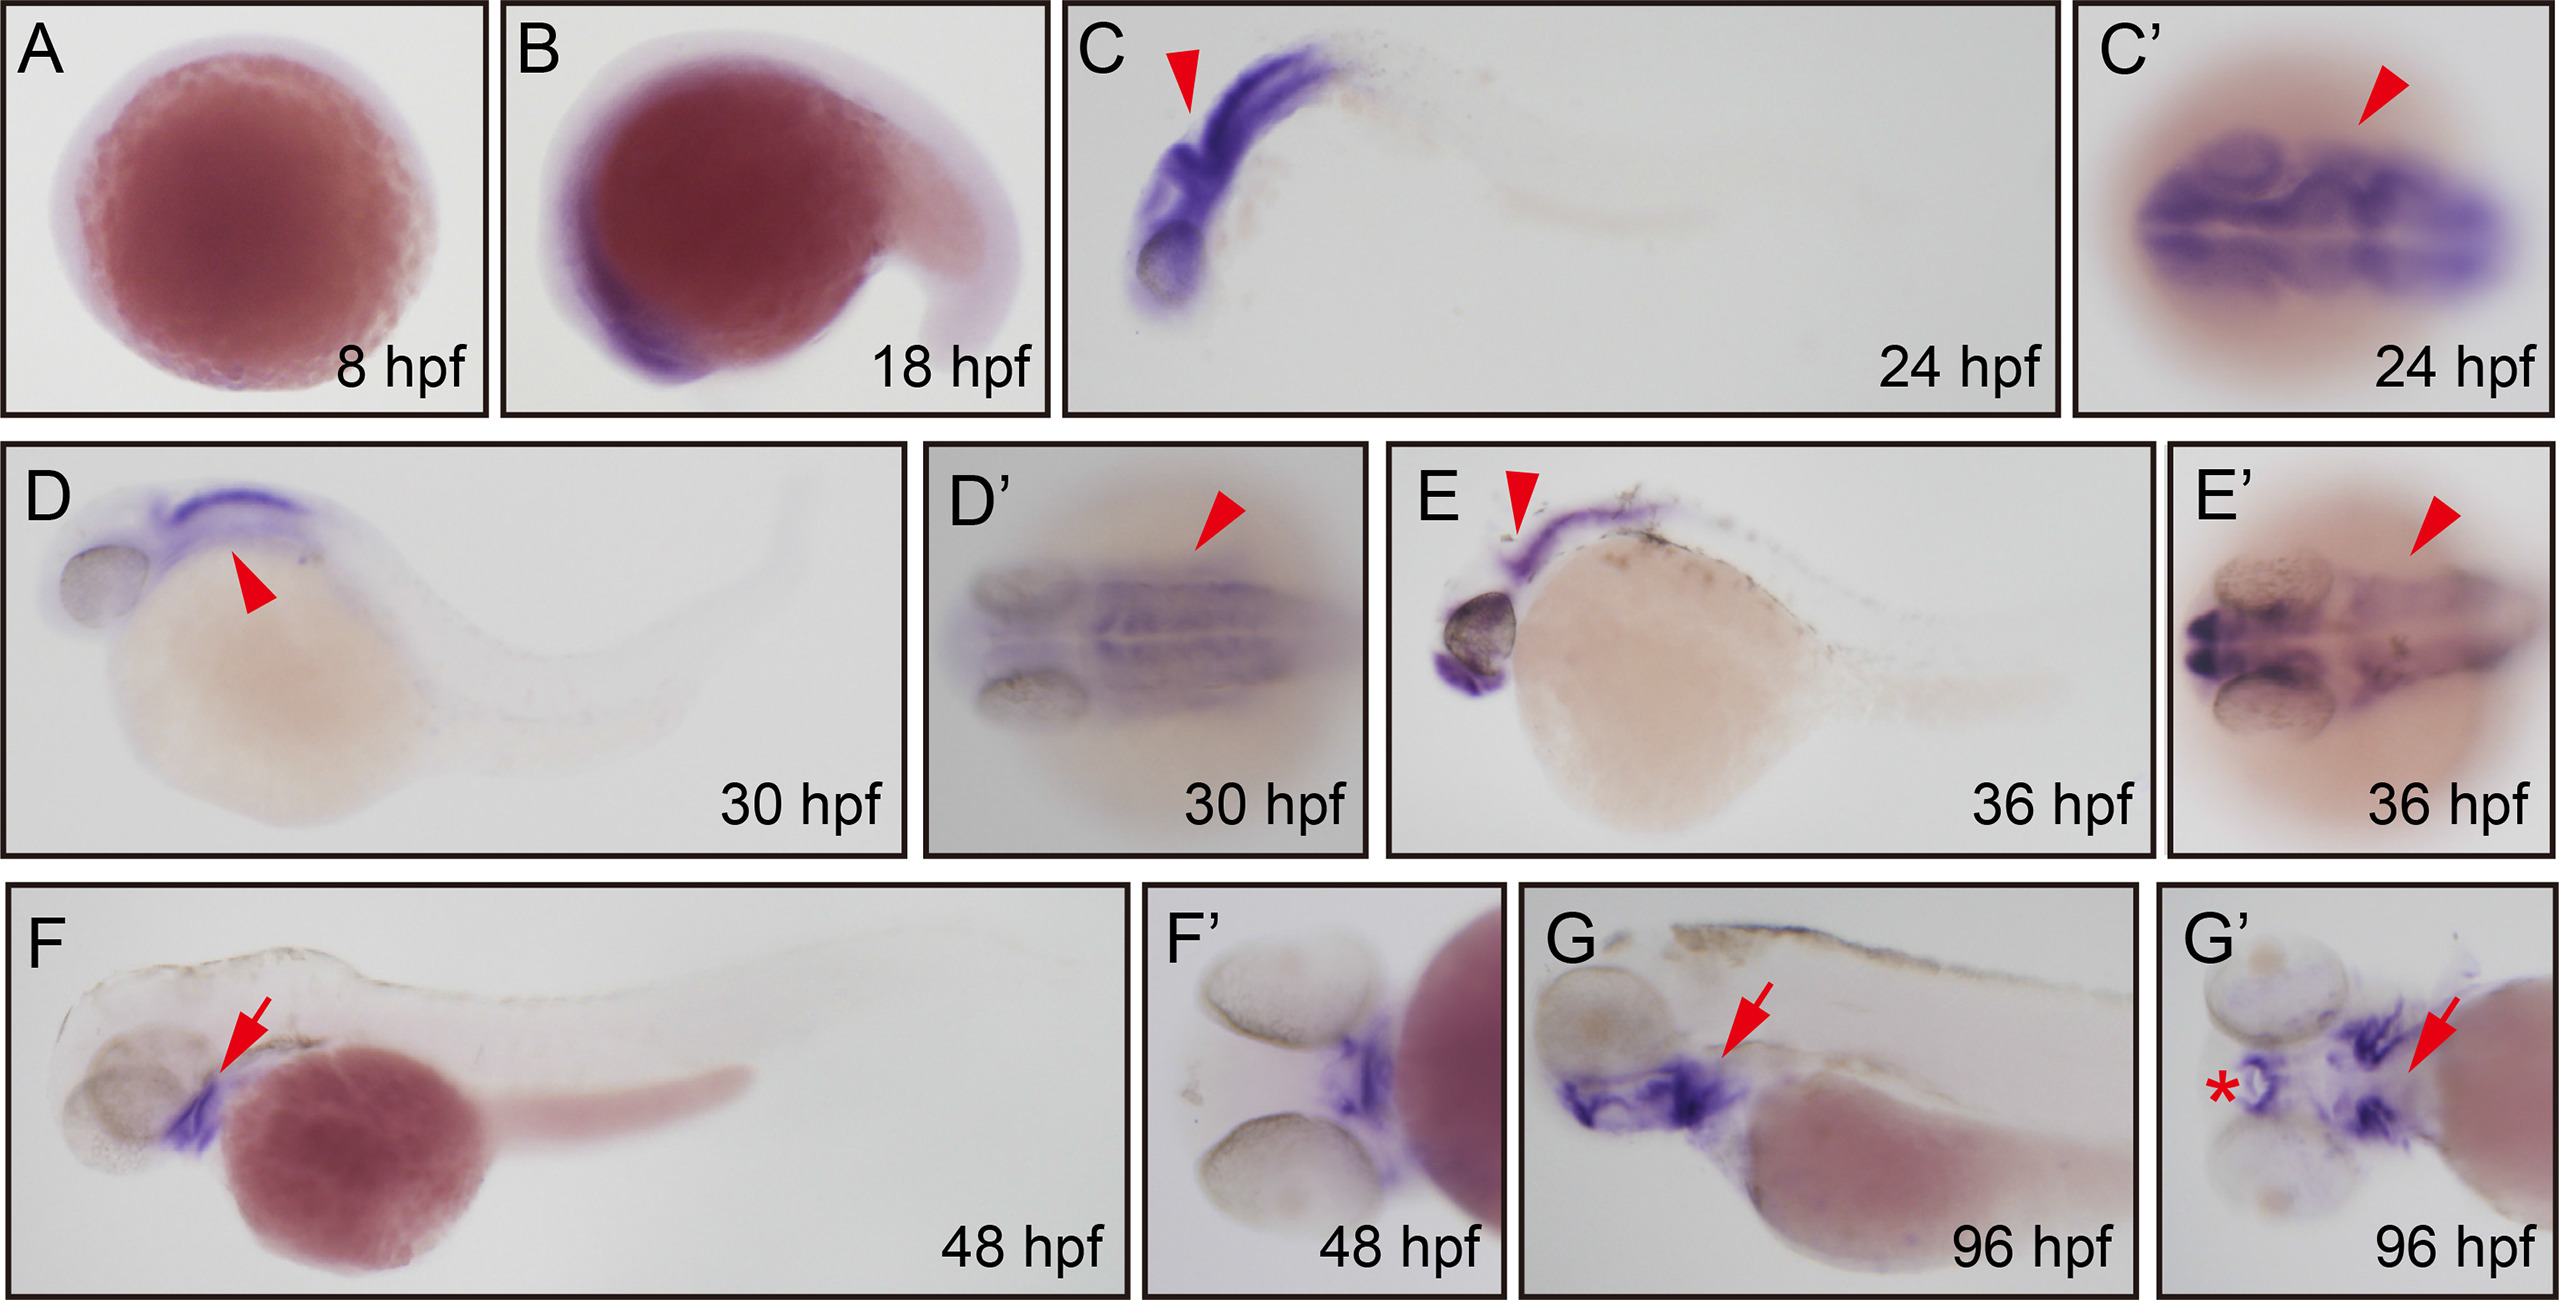
Fig. 7
Whole mount in situ hybridization analysis of zebrafish aqp10b. (A) 8 hpf, lateral view, no staining. (B) 18 hpf, overview of whole body, brain. (C) 24 hpf, overview of whole body, brain (arrowhead). (C′) 24 hpf, dorsal view, brain (arrowhead). (D) 30 hpf, overview of whole body, hindbrain (arrowhead). (D′) 30 hpf, dorsal view, hindbrain (arrowhead). (E) 36 hpf, lateral view, hindbrain (arrowhead). (E′) 36 hpf, dorsal view, hindbrain (arrowhead). (F) 48 hpf, overview of whole body, branchial arches (arrow). (F′) 48 hpf, ventral view, branchial arches. (G) 96 hpf, lateral view, branchial arches (arrow). (G′) 96 hpf, ventral view, branchial arches (arrow), mouth (asterisk)
Reprinted from Gene expression patterns : GEP, 32, Qin, Y., Wang, S., Duan, X., Liu, D., Expression analysis of the aquaporins during zebrafish embryonic development, 38-43, Copyright (2019) with permission from Elsevier. Full text @ Gene Expr. Patterns