
|
Fig. 1
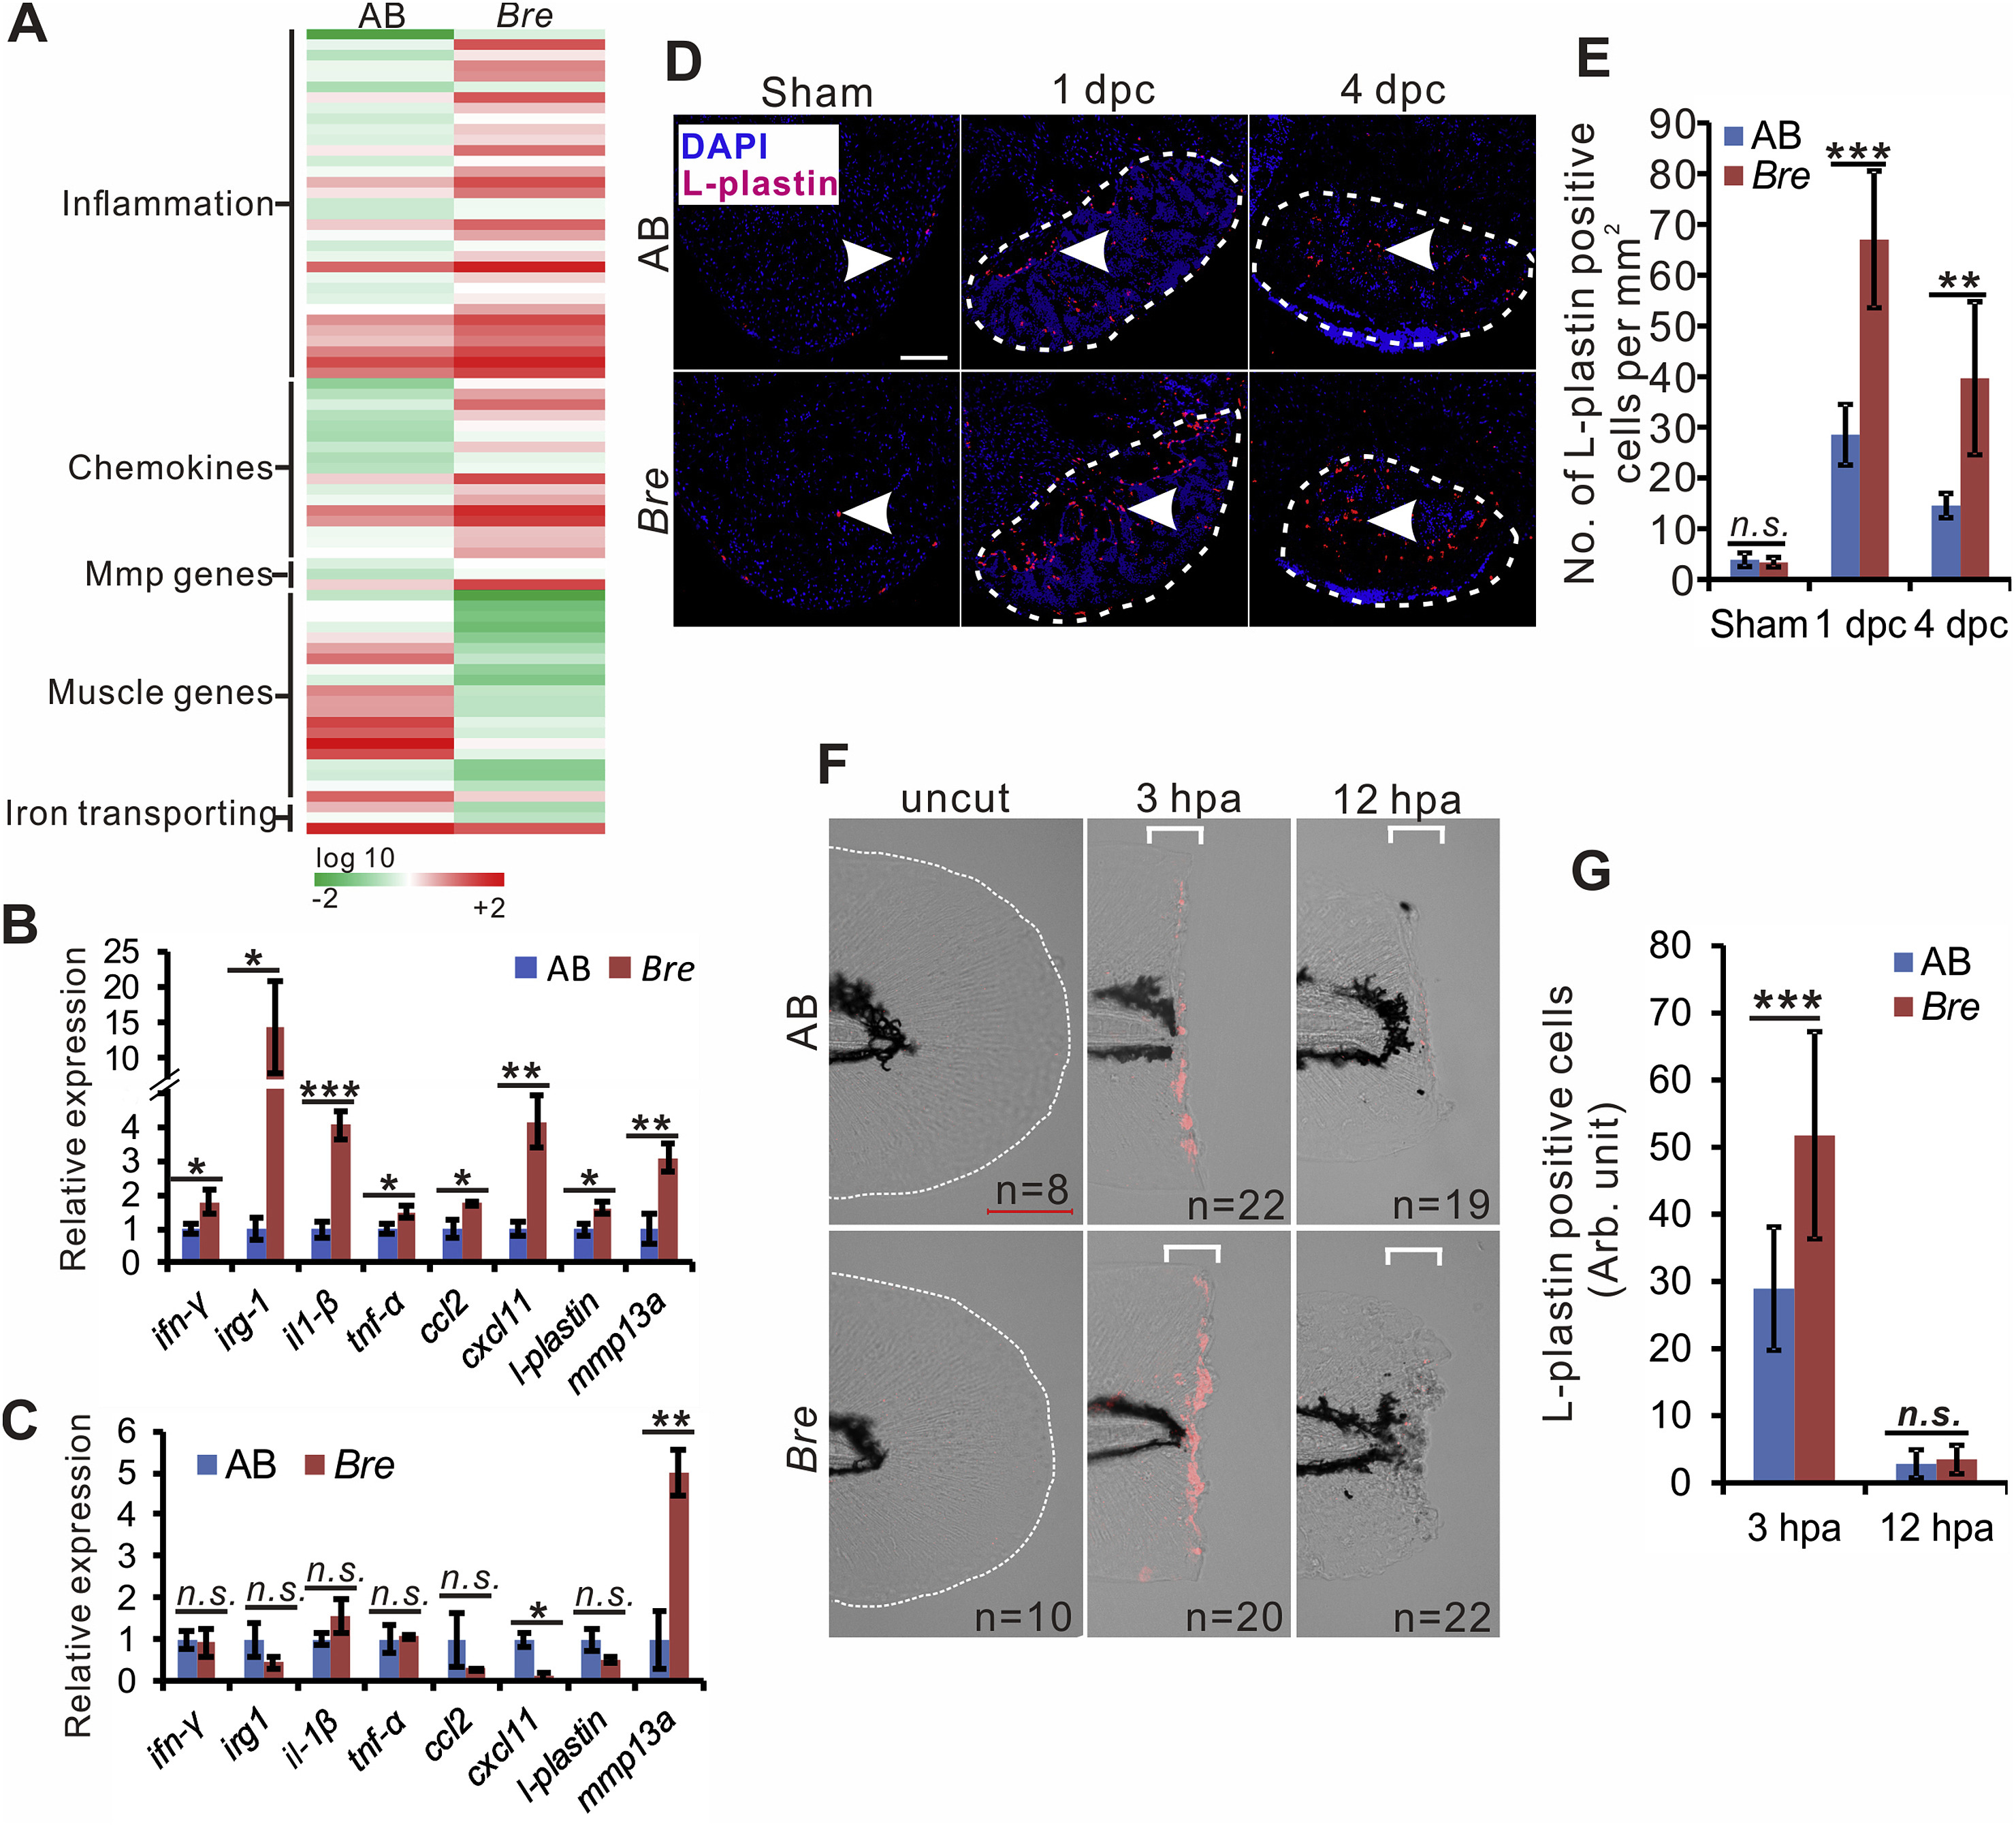
Excessive inflammation is induced in the injured tissue of bre mutant zebrafish. (A). Heat map shows transcriptome analysis of AB and bre mutant heart at 4 dpc, n = 3. (B, C). The qRT-PCR analysis of gene expression in the heart of AB and bre mutant zebrafish at 4 dpc (B), and untreated heart (C). The asterisk indicates significant difference observed at p < 0.05 (*) and p < 0.01 (**) between AB and bre mutant zebrafish, while the ‘n.s’ indicates no significant difference, n = 3, two tail t-test. (D). Representative heart sections of sham-operated, 1 dpc and 4 dpc AB wild-type and bre mutant zebrafish showing L-plastin positive cells (red, white arrowhead) in the injured area (bounded by a white dashed line). Scale bar: 100 μm. (E). Bar chart shows the quantification of L-plastin positive cells (n = 4–6) in panel (C) was significantly different at p < 0.01 (**) and p < 0.001 (***), two tail t-test. (F). Representative images displaying L-plastin positive cells (red) in the fin of bre mutant larvae. The white dash line in the panel indicates the shape of the uncut fin. Scale bar: 200 μm. (G). Bar chart shows the quantification of L-plastin positive cells in panel E was significantly different at p < 0.001 (***), two tail t-test.