
Fig. S2
- ID
- ZDB-IMAGE-190731-24
- Publication
- Nichols et al., 2019 - Pioneer axons employ Cajal's battering ram to enter the spinal cord
- All Figures
- Figures for Nichols et al., 2019
|
Fig. S2
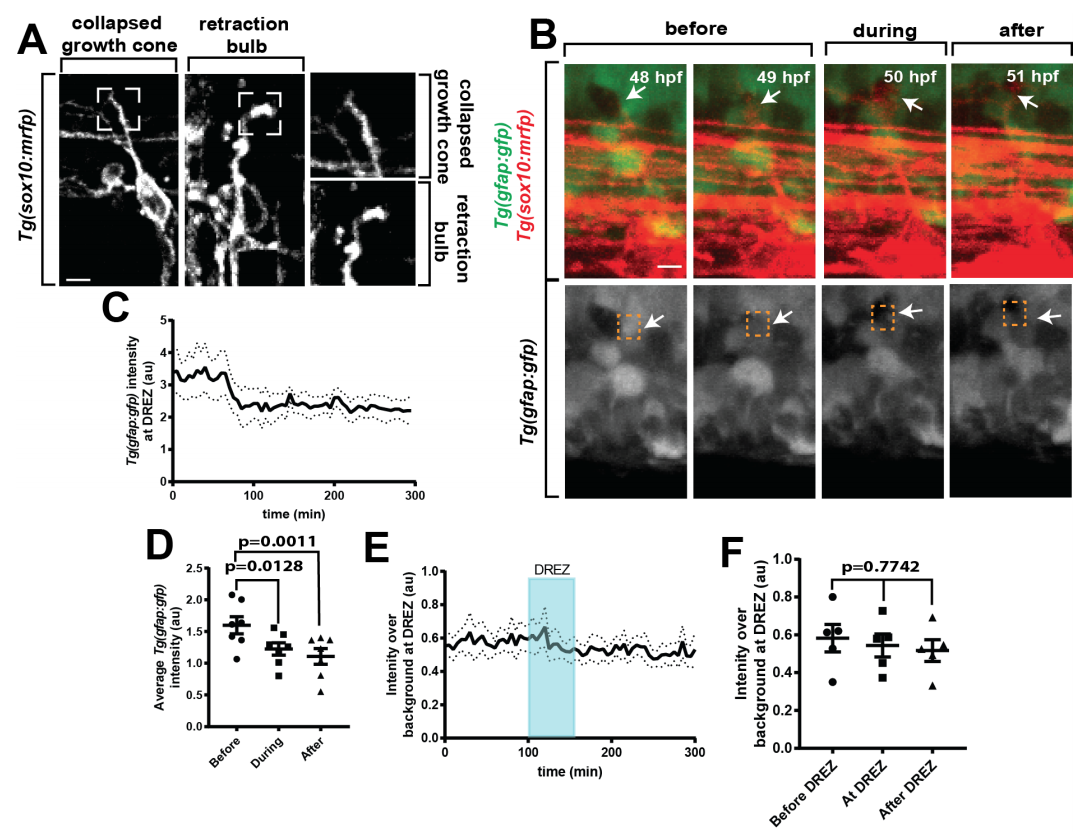
Axon entry corresponds with rearrangement of radial glia, related to Figure 2. (A). Confocal z-projection frames of Tg(sox10:mrfp) animals showing the morphologies of a collapsed growth cone and a retraction bulb. (B). Confocal z-projection frames from a 24-hr timelapse starting at 48 hpf of Tg(sox10:mrfp); Tg(gfap:gfp) zebrafish showing navigation of the pioneer axon crossing the radial glia membrane at the DREZ. White arrows denote the area of glial rearrangement during axon entry. Orange dotted box denotes DREZ. (C). Intensity profile of Tg(gfap:gfp) at the DREZ, n=7. Arrowhead denotes intensity during period of growth cone stalling at the DREZ. (D). Tg(gfap:gfp) intensity at the DREZ for before entry, during entry, and after entry. SEM is shown, n=7. (E). Quantification of Tg(gfap:gfp) intensity at the DREZ during failed entry into the spinal cord, SEM is shown, n=5 DREZ. (F). Tg(gfap:gfp) intensity at the DREZ during failed entry before DREZ navigation, during DREZ navigation, and after DREZ. SEM is shown, n=5. (D,F) use a one-way ANOVA and p-values in (D) are corrected for multiple comparisons. Scale bars denote 10 µm.