
Fig. 2
- ID
- ZDB-IMAGE-190731-17
- Publication
- Nichols et al., 2019 - Pioneer axons employ Cajal's battering ram to enter the spinal cord
- All Figures
- Figures for Nichols et al., 2019
|
Fig. 2
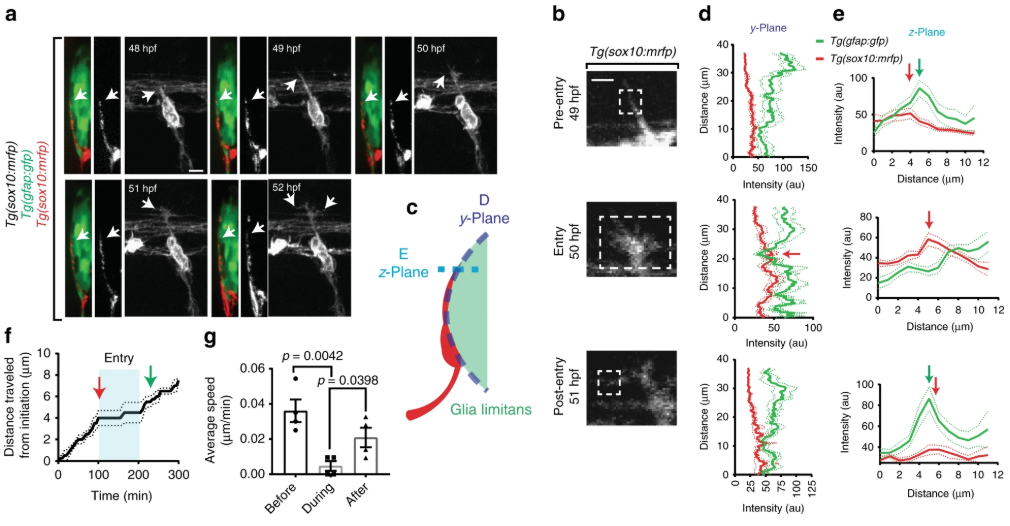
Pioneer axon changes morphology and velocity during glia limitans crossing. aConfocal y-orthoganol and z-projection frames from a 24-h time-lapse starting at 48 h post fertilization (hpf) of a Tg(gfap:gfp); Tg(sox10:mrfp) zebrafish showing axon navigation to the dorsal root entry zone (DREZ). White arrows denote the growth cone. b Deconvolved confocal single-frames from a 24-h time-lapse starting at 48 hpf of the pioneer axon of a Tg(sox10:mrfp) zebrafish before during and after glia limitans crossing. The growth cone swells during spinal entry. White box denotes the growth cone. c–e Diagram of the y- and z-planes of the DREZ showing how the graphs of (d, e) were taken on y-orthogonal images. Graphs in (d, e) denote intensity profiles of Tg(gfap:gfp) and Tg(sox10:mrfp) across the y- (d) and z-planes (e) of the growth cone in y-orthogonal images before, during, and after entry at the DREZ. The green fluorescent protein (GFP) intensity at the DREZ specifically decreases during axon entry. Red arrows denote decrease in Tg(gfap:gfp) intensity during pioneer axon entry. SEM is shown, n = 13 DREZ. f Quantification of the distance traveled by representative growth cones from the point of initiation through entry into the DREZ. Arrows denote time of axon (red) and glia (green) DREZ contact from Fig. 1g. Blue shaded box denotes the time the growth cone is at the DREZ. Blue lines denote SEM of 4 axons. g Average velocity form of the growth cones before, during, and after entry. SEM is shown, n = 4 pioneer axons. Scale bars denote 10 µm in (a) and 5 µm in (b). Tukey’s honestly significant difference (HSD) (g)