
Image
|
Figure Caption
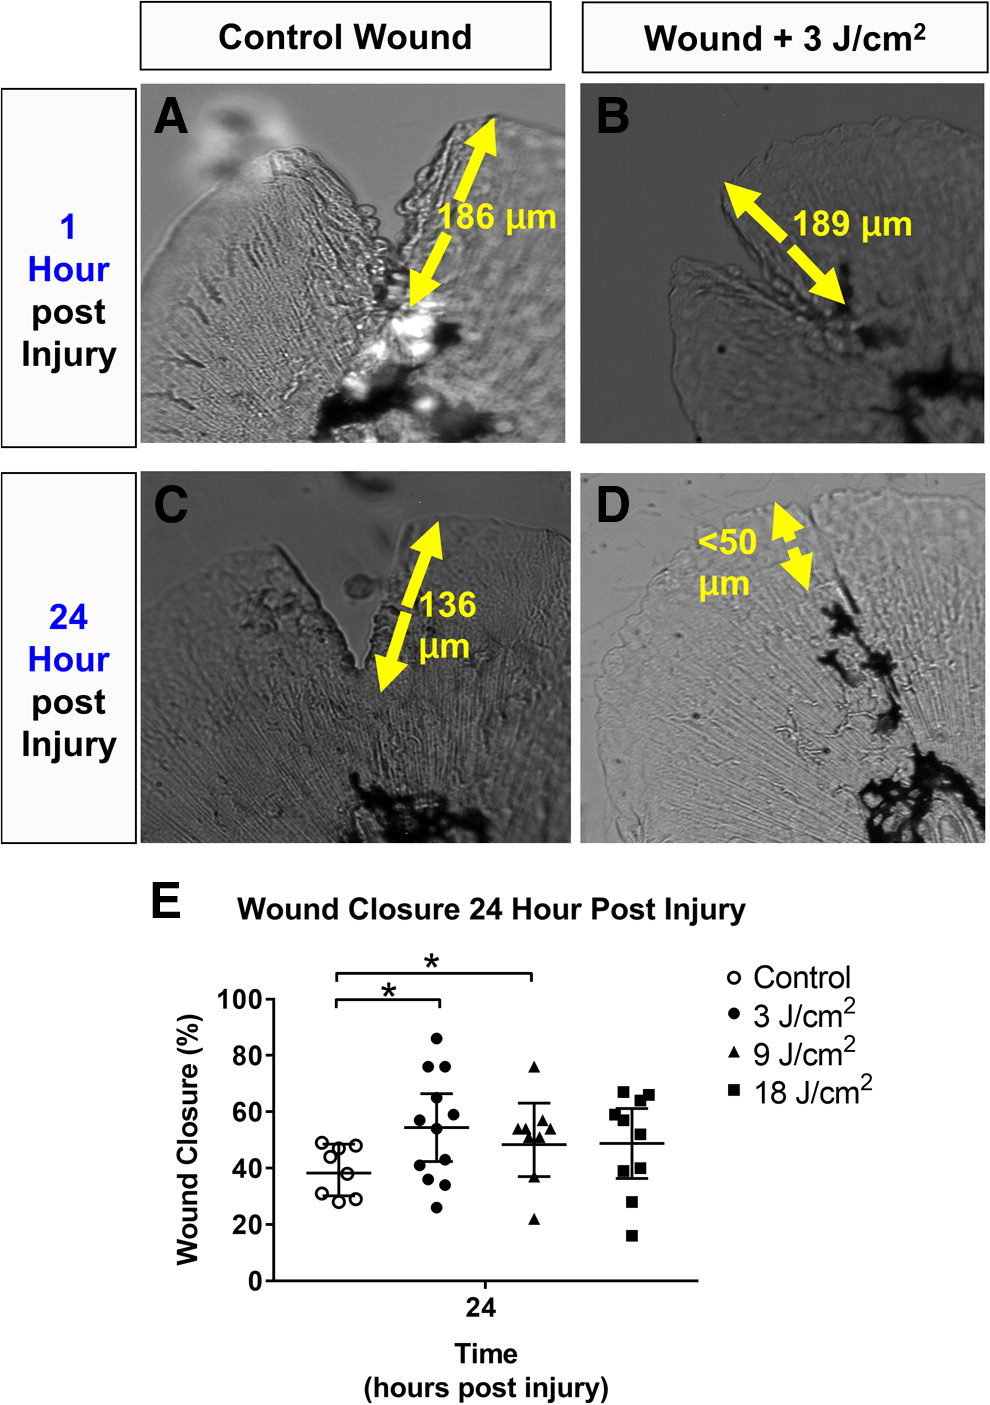
Fig. 4
(A) and (B) show caudal fin wound region 1 h post wounding. (C) and (D) display the wound region 24 h post wounding, untreated and treated with (3 J/cm2) laser, respectively. (E) displays the geometric mean ± 95% confidence interval of percentage wound closure from 1 to 24 h postwound of untreated control group (n = 8) and 3, 9, and 18 J/cm2laser-treated groups (n = 12, 9, and 10, respectively). Student's t-tests (*p < 0.05) were performed in Microsoft Excel and wound measurements were performed in ImageJ.
Acknowledgments
This image is the copyrighted work of the attributed author or publisher, and
ZFIN has permission only to display this image to its users.
Additional permissions should be obtained from the applicable author or publisher of the image.
Full text @ Photobiomodul Photomed Laser Surg