Fig. 6
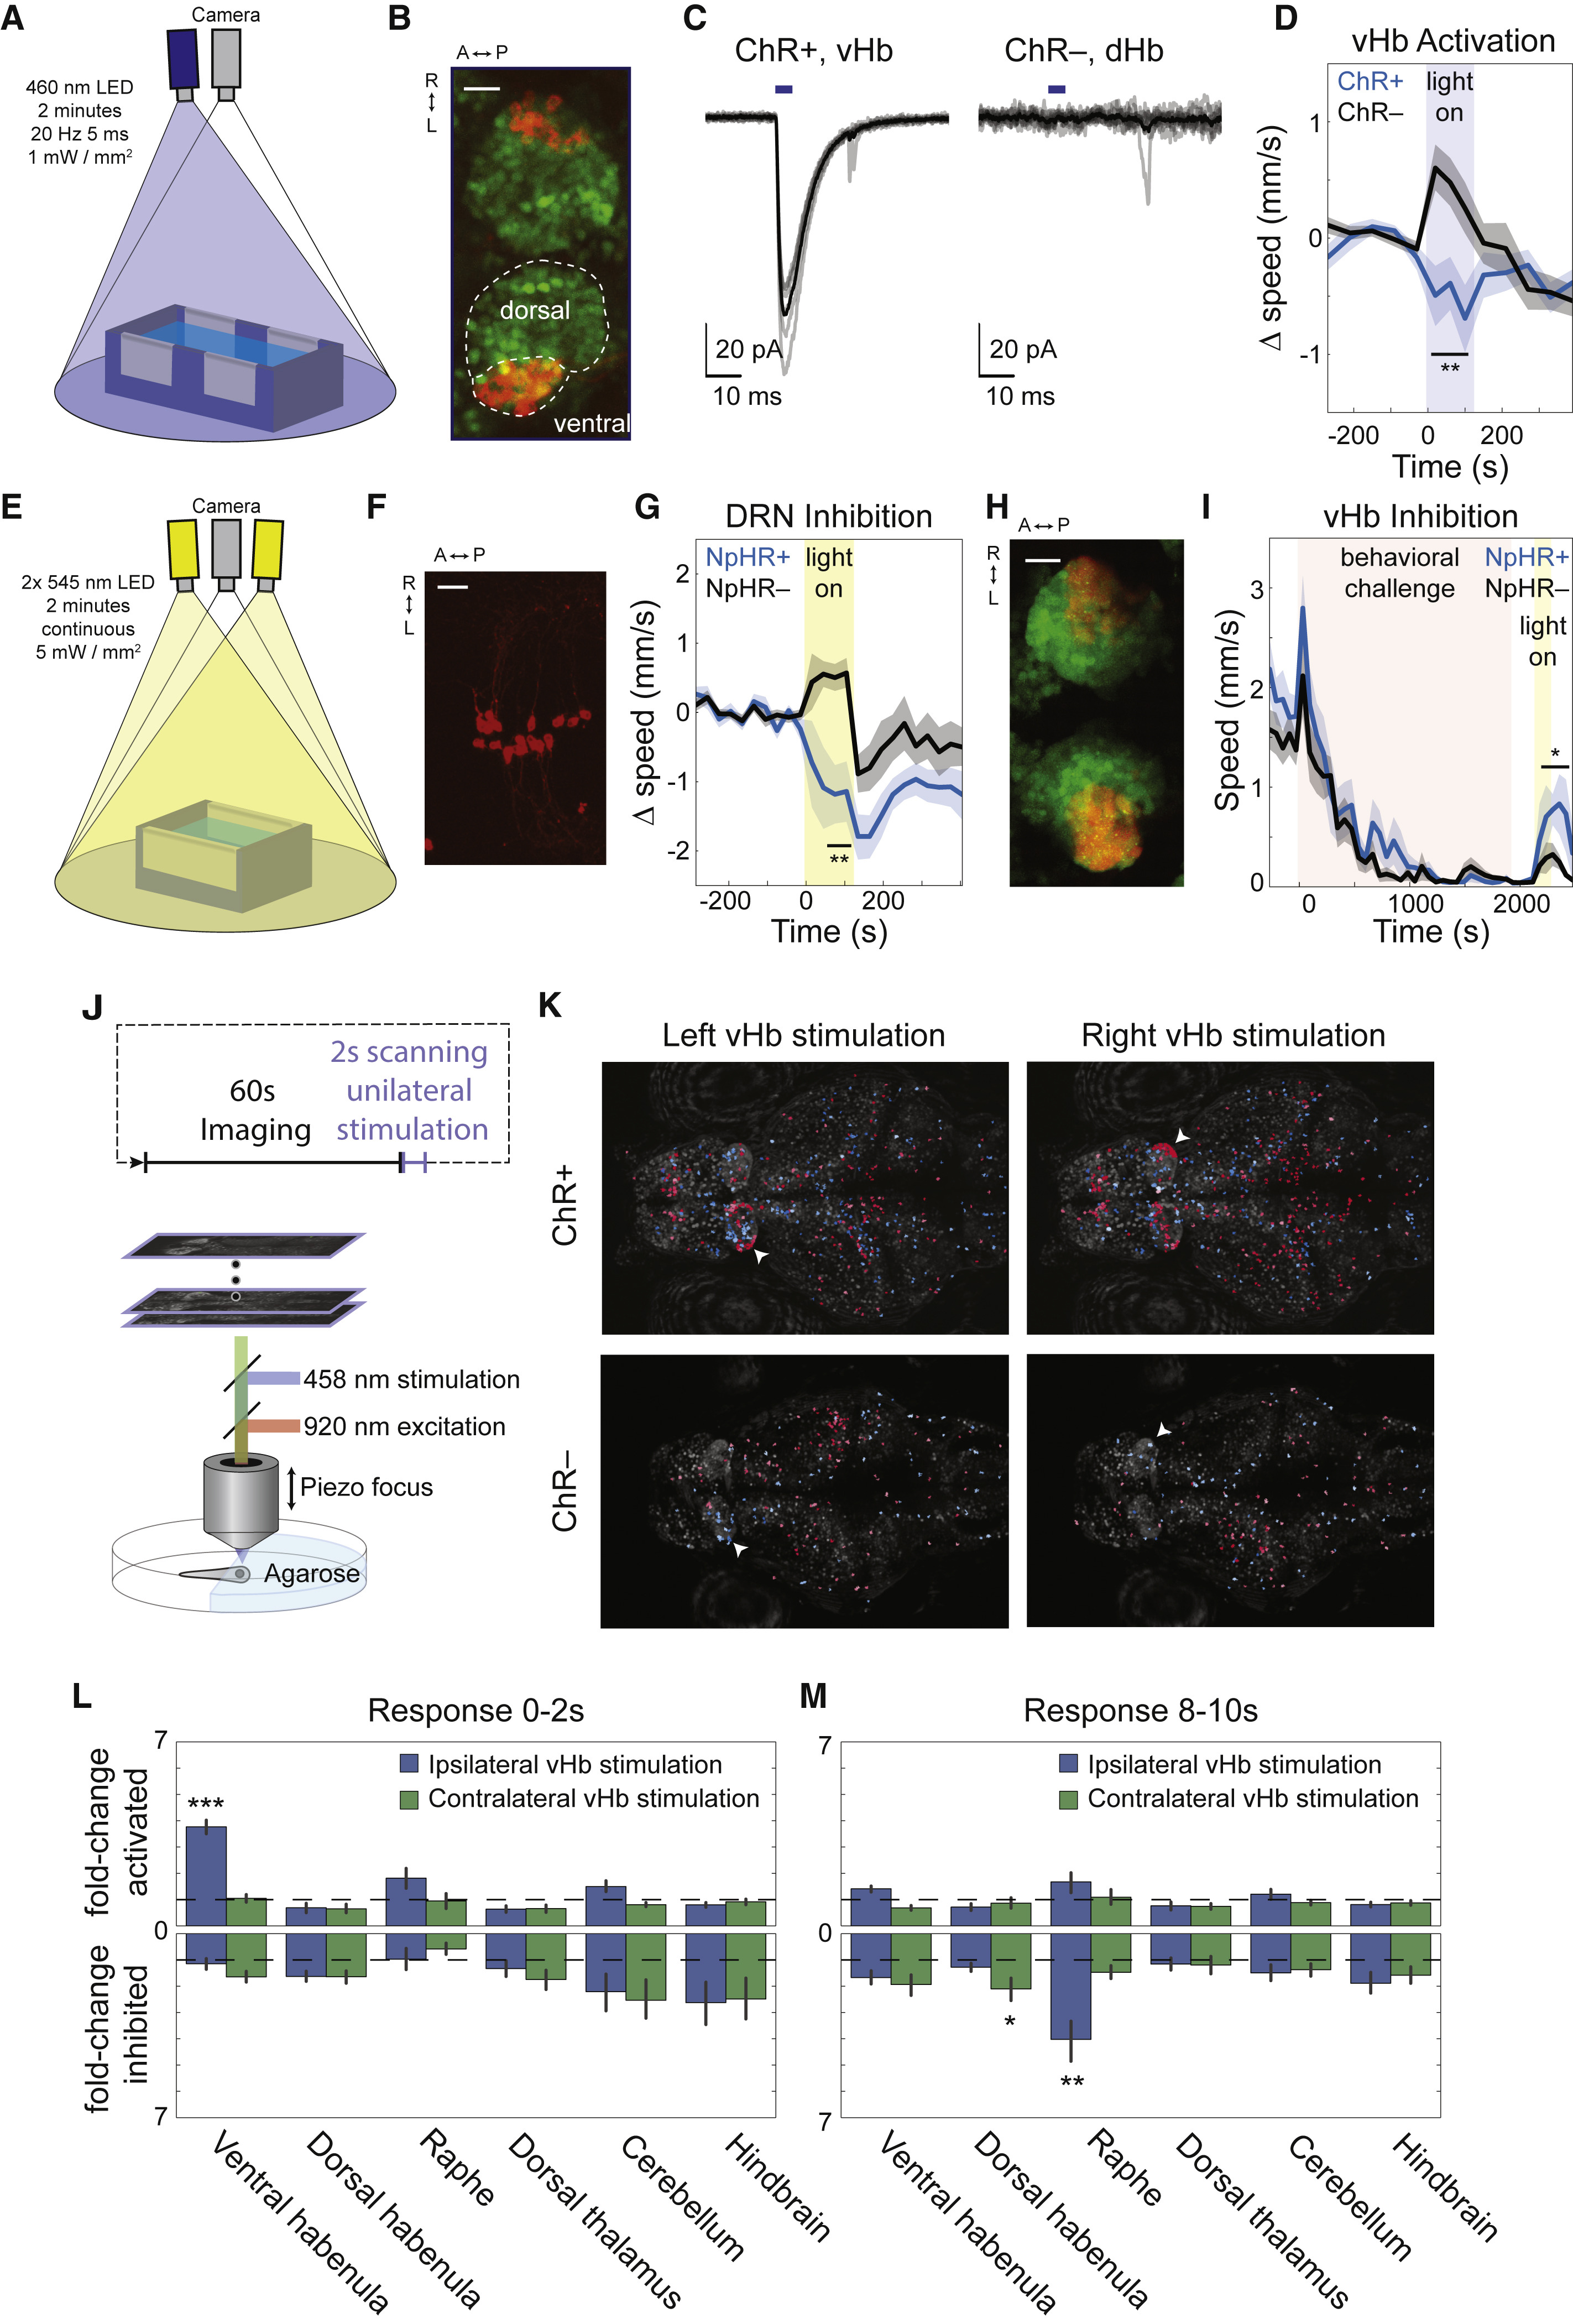
Optogenetic Activation of vHb Causally Evokes Passive-State Behavior and Brainwide Activity Dynamics
(A) Rig used to activate ChR in free-swimming fish.
(B) Max-projection of confocal stack of Hb in 15 dpf Tg(ppp1r14ab:Gal4-VP16; UAS:ChR2-mCherry;elavl3:h2b-GCaMP6s) showing expression pattern of ppp1r14ab (red) on elavl3 background (green; scale bar, 25 μm; see also Figure S6A).
(C) Inward photocurrents in an in vivo voltage-clamped ChR2-mCherry+ vHb neuron (left) and ChR2-mCherry– dHb neuron (right), evoked by 5-ms pulses of 475-nm light (blue bars; average response indicated by solid black line, n = 6 ChR+ pulses, 8 ChR– pulses).
(D) Baseline-subtracted speed of ChR+ fish, Tg(ppp1r14ab:Gal4-VP16; UAS:ChR2-mCherry) (blue, n = 10), and ChR– clutch mates (black, n = 11) in response to 2 min of 20 Hz 460-nm light pulses (5 ms duration; 1 mW/mm2; 4-min baseline). During stimulation, the ChR+ fish showed reduced speed compared to ChR– fish (p = 0.0038) and compared to baseline (p = 0.048, paired Student’s t test). In contrast, the visible blue light caused ChR– fish to show an increase in speed (p = 0.040, paired Student’s t test). See also Figure S6B.
(E) Rig used to activate NpHR in free-swimming fish.
(F) Max-projection of 2P stack of superior raphe in 13 dpf Tg(tph2:Gal4ff; UAS:NpHR-mCherry) (scale bar, 25 μm).
(G) Baseline-subtracted speed of NpHR+ fish, Tg(tph2:Gal4ff; UAS:NpHR-mCherry) (blue, n = 11), and NpHR– clutch mates (black, n = 10) in response to 2 min of continuous 545-nm light (5 mW/mm2; 4-min baseline). NpHR+ fish showed reduced speed during the second minute of inhibition compared to baseline (p = 0.039, paired Student’s t test) as well as compared to NpHR– fish (p = 0.0039). In contrast, the visible yellow light caused NpHR– fish to show an increase in speed (p = 0.013, paired Student’s t test).
(H) Max-projection of confocal stack of Hb in 15 dpf Tg(dao:Cre-mCherry; vglut2a:loxP-DsRed-loxP-GFP) showing GFP expression in dao+ and vglut2a+ cells (red) and DsRed in other vglut2a+ cells (green) (scale bar, 25 μm).
(I) Speed of NpHR+ Tg(dao:Gal4-VP16; UAS:NpHR-mCherry) fish (blue, n = 8) and NpHR– clutch mates (black, n = 10) in response to BC followed by 2 min of continuous 545-nm light (5 mW/mm2). NpHR+ fish showed a significantly larger increase in speed than NpHR– fish during the second minute of inhibition and the 2 min following stimulation (p = 0.034). Both the NpHR+ and NpHR– cohorts showed a significant increase in speed compared to the 4-min baseline period prior to light onset (p = 0.009 and p = 0.027, respectively; paired Student’s t test).
(J) 2P Ca2+ imaging of the response to unilateral one-photon laser scanning stimulation of the vHb.
(K) Max projection of ChR+ and ChR– fish (site of stimulation indicated by white arrows). ROIs of the neurons with a significant response to simulation (p < 0.05, see STAR Methods) are colored red if activated and blue if inhibited.
(L) Fold-change in the fraction of neurons that showed a significant excitatory response in the 2 s following stimulation in ChR+ fish (n = 6) compared to ChR–fish (n = 4) in several regions both ipsilateral and contralateral to the site of stimulation (top). The analogous plot for inhibitory responses (bottom). The ipsilateral vHb showed a significant activation (p = 0.00002). See also Figure S6D.
(M) Analogous to (L) for the period 8–10 s following stimulation. The ipsilateral raphe showed a significant increase in the number of inhibitory responses during this period (p = 0.004), as did the contralateral dHb (p = 0.048).
Reprinted from Cell, 177(4), Andalman, A.S., Burns, V.M., Lovett-Barron, M., Broxton, M., Poole, B., Yang, S.J., Grosenick, L., Lerner, T.N., Chen, R., Benster, T., Mourrain, P., Levoy, M., Rajan, K., Deisseroth, K., Neuronal Dynamics Regulating Brain and Behavioral State Transitions, 970-985.e20, Copyright (2019) with permission from Elsevier. Full text @ Cell

