
Image
|
Figure Caption
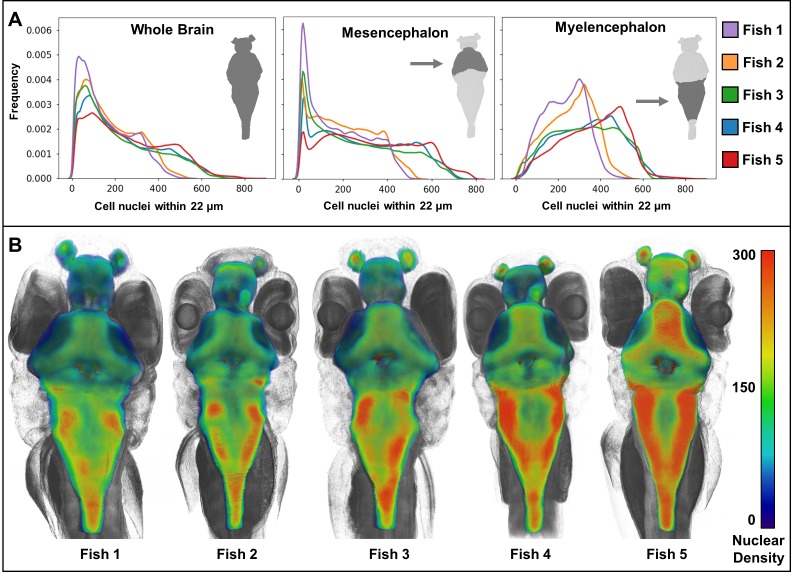
Figure 9.
Cellular density varies between individual brain regions and carries distinct signals consistent between individual samples (
Acknowledgments
This image is the copyrighted work of the attributed author or publisher, and
ZFIN has permission only to display this image to its users.
Additional permissions should be obtained from the applicable author or publisher of the image.
Full text @ Elife