IMAGE

Figure 1—figure supplement 2.

ID
ZDB-IMAGE-190723-905
Source
Figures for Ding et al., 2019
Image
Figure Caption

Figure 1—figure supplement 2. Sample-to-scintillator distance selection for synchrotron X-ray micro-tomography.

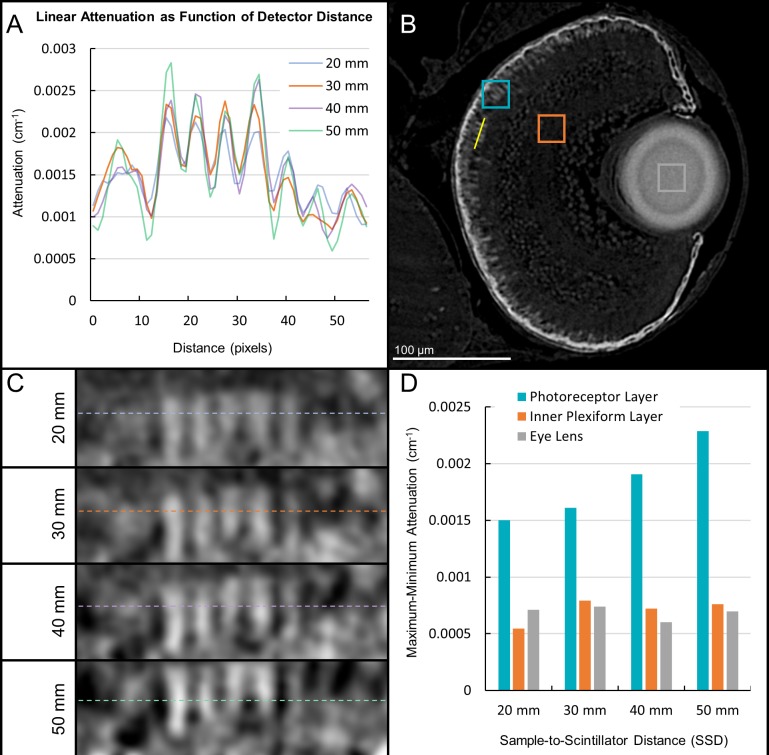
A range of sample-to-scintillator distances (SSD) was surveyed for phase contrast enhancement of edges in larval samples. A line profile (A) is drawn through the retinal region as denoted by the yellow line in (B) to highlight differences in voxel intensity at edges. Zoomed insets (C) show the photoreceptor layer aligned with the attenuation profile in (A). The attenuation range (maximum attenuation– minimum attenuation) is shown in (D) for homogenous (lens, inner plexiform layer) and variable (photoreceptor layer) regions. The attenuation range increases for variable regions but remains constant for homogenous regions as SSD increases, demonstrating the effects of phase contrast edge enhancement. A SSD of 30 mm provided a level of edge perception resembling that found in traditional glass slide histology and was used for all subsequent acquisitions.

Acknowledgments
This image is the copyrighted work of the attributed author or publisher, and ZFIN has permission only to display this image to its users. Additional permissions should be obtained from the applicable author or publisher of the image. Full text @ Elife