
Figure 5
- ID
- ZDB-IMAGE-190723-876
- Publication
- Henriques et al., 2019 - Nucleus Isthmi Is Required to Sustain Target Pursuit during Visually Guided Prey-Catching
- All Figures
- Figures for Henriques et al., 2019
|
Figure 5
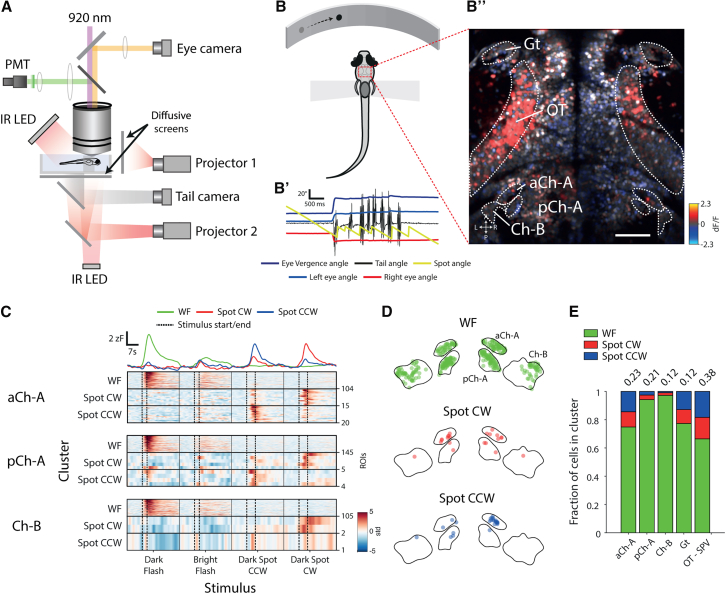
NI Neurons Respond to Looming and Prey-like Visual Stimuli
(A) Schematic of the 2-photon setup to record neuronal activity and visually evoked behavior in tethered larval zebrafish.
(B) Schematic of the virtual hunting assay. (B’) Tail, eye, and stimulus dynamics during a tethered hunting routine are shown. The prey-like spot is moved to the midline when the fish converges its eyes and after subsequent swim bouts. (B”) Map of neuronal activity (ΔF/F) in response to a leftward moving prey-like spot is shown. Scale bar, 50 μm.
(C) Visual responses of isthmic neurons. Rasters show VRVs of cells assigned to visual clusters in the virtual hunting experiment. Top traces represent the mean VRV for all clustered isthmic neurons.
(D) Anatomical distribution of visually responsive cells in the isthmus, colored by cluster type. For illustration purposes, the distances between regions have been offset, but distances within each region are correct. Boundaries are drawn at a single dorsoventral level.
(E) Visual response types by brain region. Numbers on top show the fraction of cells in the brain region that were assigned cluster identities (aCh-A, n = 139; pCh-A, n = 154; Ch-B, n = 108; Gt, n = 194; OT-SPV, n = 3,703).
See also