
|
Figure 1
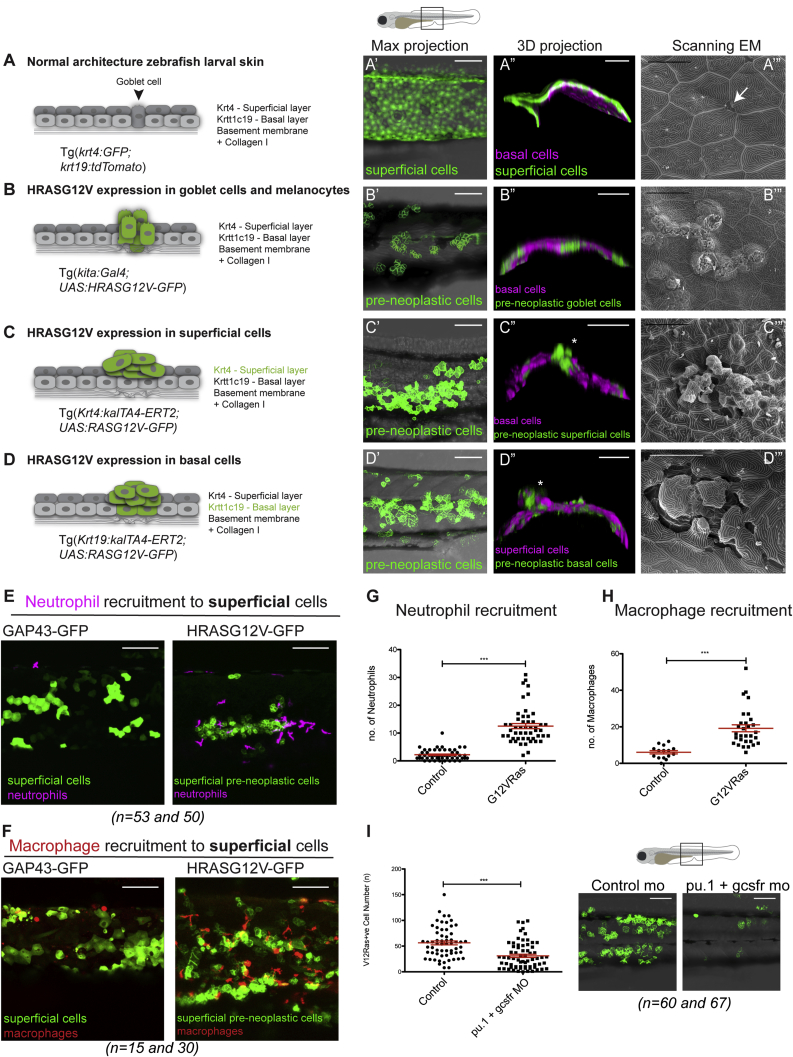
Zebrafish Skin Cancer Models and Immune Cell Recruitment
(A) WT 3 dpf larval skin: superficial cell layer (dark gray in A, GFP [green] in A′ and A″) and basal cell layer (light gray in A, magenta in A″) with underlying basement membrane (BM).
(A″′) Scanning electron microscopy shows a goblet cell (arrow in A and A″′, green in B) in the epidermis.
(B) kita:RAS model. HRASG12V-GFP expressing goblet cells in 7 dpf larva over-proliferate (green in B, B′, and B″). Basal cells are in magenta (B″). Tracks of goblet cells by scanning electron microscopy (B″′).
(C and D) K4:RAS and K19:RAS models. HRASG12V-GFP expression (48 h postinduction [hpi] of 4OHT) in superficial (C and C′) or basal (72 hpi) (D and D′) pre-neoplastic cells is shown in green.
(C) HRASG12V-GFP-expressing superficial clones (basal cells shown in magenta) in 3 dpf larva (asterisk, C″) and scanning electron microscopy (72 hpi) (C″′).
(D) HRASG12V-GFP-expressing basal clones in 5 dpf larva (superficial cells in magenta) (asterisk in D″ and scanning electron microscopy in D″′).
(E–H) Mosaic expression of oncogenic HRASG12V in skin cells compared with control GAP-43 GFP expression results in recruitment of neutrophils (magenta; E) and macrophages (red; F) 48 hpi, quantified in (G) and (H), respectively. See also
(I) Knockdown of both neutrophils and macrophages (with PU.1 and granulocyte colony stimulating factor [GCSF] MOs) inhibits superficial pre-neoplastic cells growth (GFP) in 48 hpi larvae.
Scale bars: 100 μm (A′, A″, B′, B″, C′, C″, D′, D″, E, F, and I); 20 μm (A″′, B″′, C″′, and D″′). Graphs display mean ± SEM.