
IMAGE
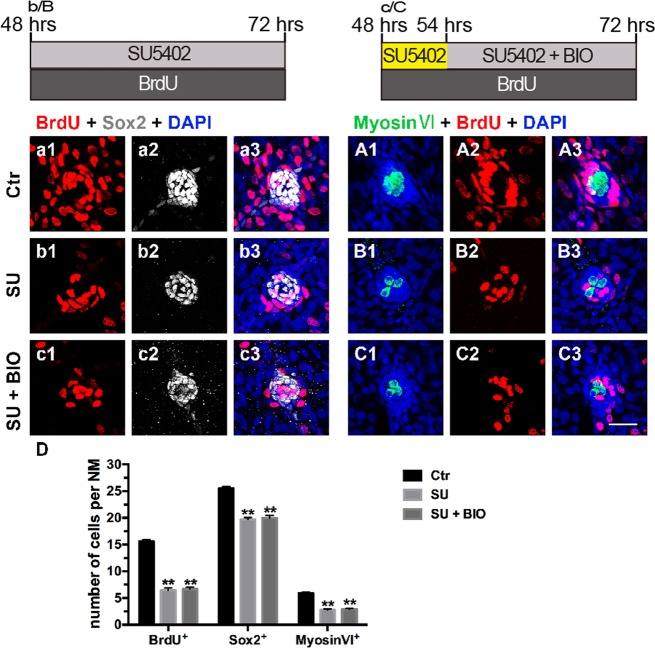
Fig. 3
- ID
- ZDB-IMAGE-190723-628
- Publication
- Tang et al., 2019 - Wnt/β-catenin interacts with the FGF pathway to promote proliferation and regenerative cell proliferation in the zebrafish lateral line neuromast
- All Figures
- Figures for Tang et al., 2019
Image
|
Figure Caption
Fig. 3
Acknowledgments
This image is the copyrighted work of the attributed author or publisher, and
ZFIN has permission only to display this image to its users.
Additional permissions should be obtained from the applicable author or publisher of the image.
Full text @ Exp. Mol. Med.