
Fig. 1
- ID
- ZDB-IMAGE-190723-626
- Publication
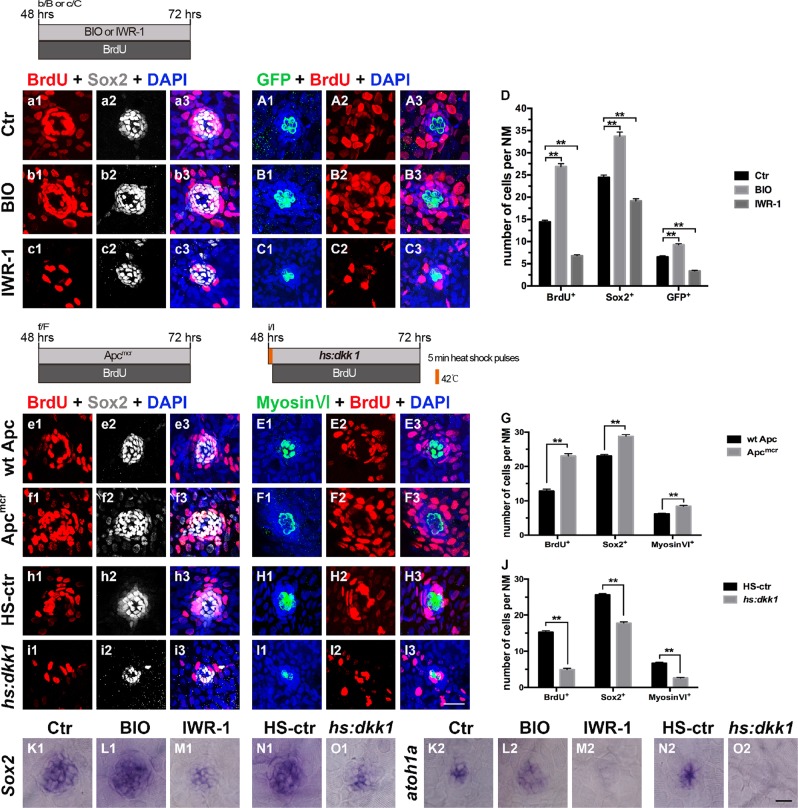
- Tang et al., 2019 - Wnt/β-catenin interacts with the FGF pathway to promote proliferation and regenerative cell proliferation in the zebrafish lateral line neuromast
- All Figures
- Figures for Tang et al., 2019
|
Fig. 1