
Figure 4
- ID
- ZDB-IMAGE-190723-491
- Publication
- Hadjivasiliou et al., 2019 - Basal Protrusions Mediate Spatiotemporal Patterns of Spinal Neuron Differentiation
- All Figures
- Figures for Hadjivasiliou et al., 2019
|
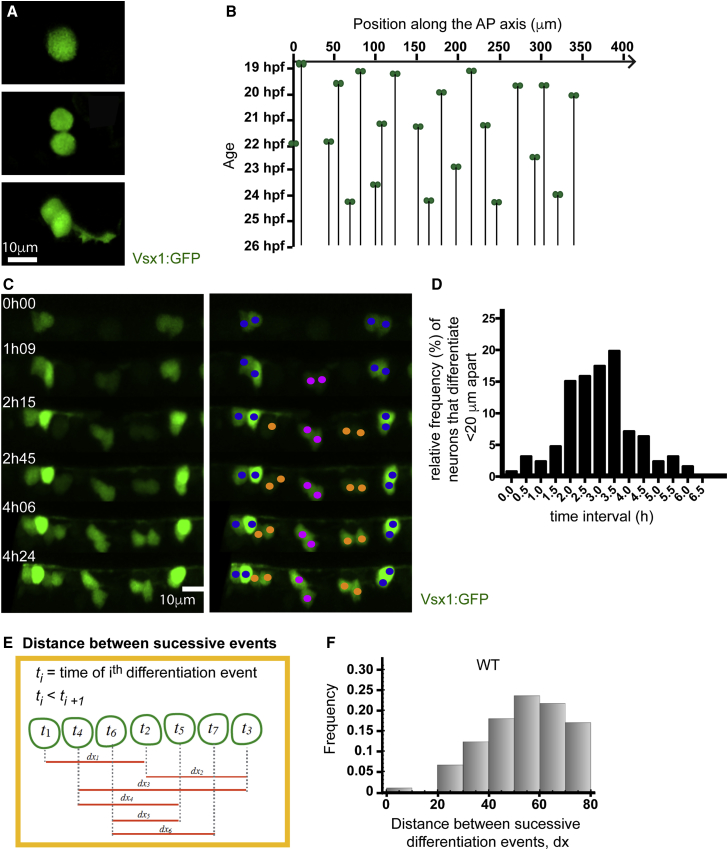
Figure 4
Neurons Rarely Differentiate Close Together in Time and Space
(A) Vsx1:GFP expression in a single cell before, during, and after a NAP division. Following mitosis, GFP expression is maintained, and axogenesis can be followed in both daughter neurons.
(B) Spatiotemporal pattern of Vsx1:GFP neuronal precursor differentiation from 19 to 27 hpf. The location of Vsx1:GFP NAPs at the time of mitosis are represented as pairs of green circles and plotted in space (x axis) and time (y axis). The black lines descending through time from the pair of green circles represent the position held by the daughter cells after mitosis.
(C) Image sequence from a time lapse showing the differentiation of Vsx1:GFP neurons in one section of spinal cord through time. The left panel shows Vsx1:GFP neurons differentiating over time. In the right panel, cells have been color coded to denote sister pairs. All images are projections from small confocal z stacks. See also
(D) Frequency distribution showing the difference in time between Vsx1:GFP mitoses that occur less than 20 μm apart.
(E) Diagram illustrating the method used to calculate the distance between successive Vsx1:GFP differentiation events from a time-lapse movie.
(F) Histogram showing the distribution of the distance between successive Vsx1:GFP differentiation events in wild-type embryos.
Reprinted from Developmental Cell, 49, Hadjivasiliou, Z., Moore, R.E., McIntosh, R., Galea, G.L., Clarke, J.D.W., Alexandre, P., Basal Protrusions Mediate Spatiotemporal Patterns of Spinal Neuron Differentiation, 907-919.e10, Copyright (2019) with permission from Elsevier. Full text @ Dev. Cell