IMAGE

Figure 2

ID
ZDB-IMAGE-190723-451
Source
Figures for Carnovali et al., 2019
Image
Figure Caption

Figure 2

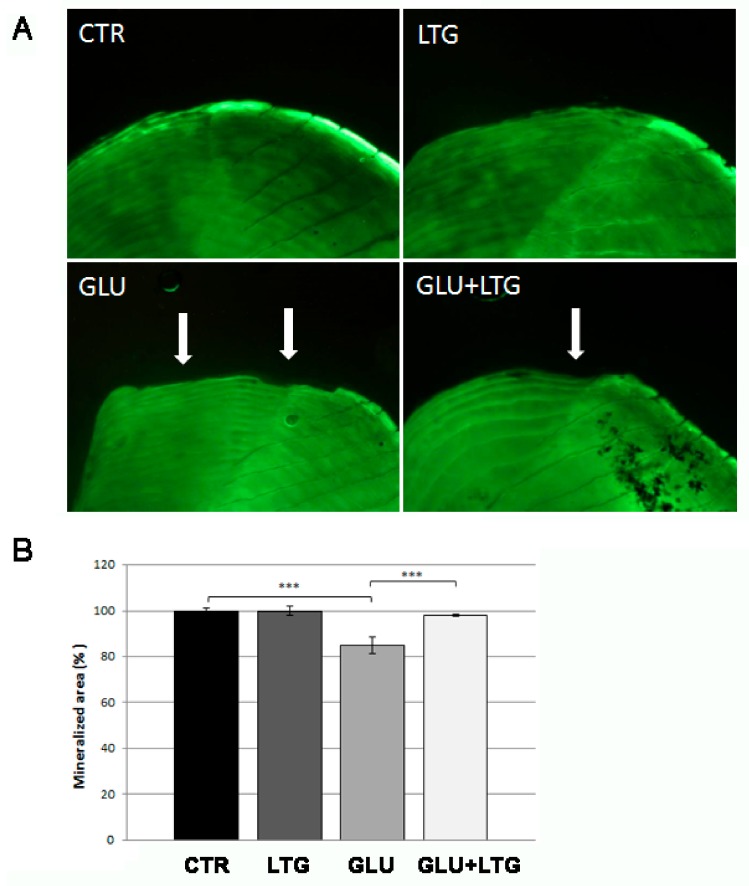
(A) Calcein vital staining of fish scales. The mineralized tissue profile can be observed in untreated (CTR) scales or treated with LTG, glucose, and GLU + LTG. Mineralized matrix resorption lacunae are indicated by white arrows. (B) Quantification of mineralized area of the scale (CTR vs. GLU, p < 0.001; GLU + LTG vs. GLU, p < 0.001). p < 0.001 (***).

Acknowledgments
This image is the copyrighted work of the attributed author or publisher, and ZFIN has permission only to display this image to its users. Additional permissions should be obtained from the applicable author or publisher of the image. Full text @ Nutrients