
|
Figure 2
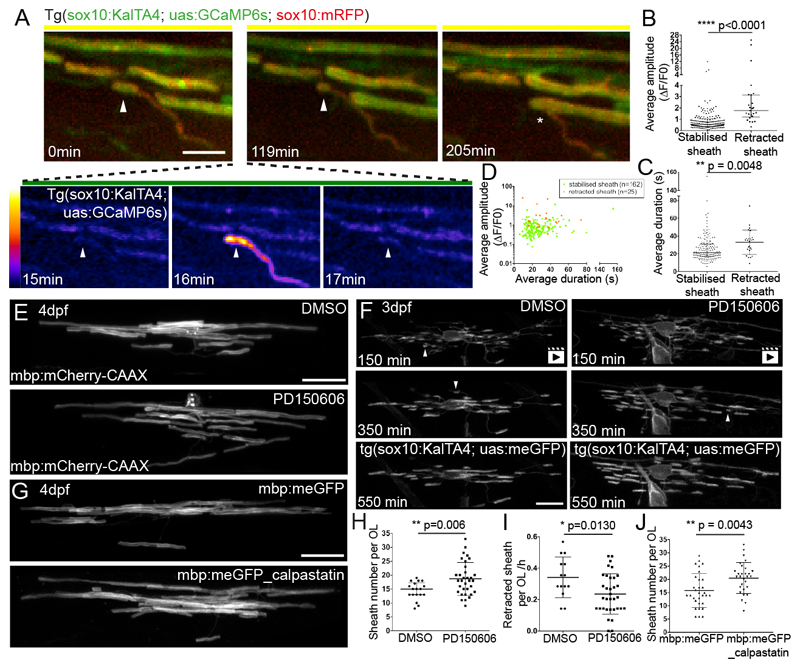
A. Frames from a time-lapse imaging experiment. The myelin sheath imaged in high-resolution mode (0 min) exhibits a Ca2+ transient 16 minutes into a period of high-speed GCaMP6s imaging (see also
B. Average amplitude of Ca2+ transients in sheaths that are either stabilised or fully retracted (n=25 retracted sheaths, 12 animals and n=162 stabilised sheaths, 18 animals; Graph shows median and 1st and 3rd quartiles. Two-tailed Mann-Whitney test, p<0.0001.
C. Average duration of Ca2+ transients in sheaths shown in B. Graph shows median and 1st and 3rd quartiles. Two-tailed Mann-Whitney test, p=0.0048.
D. Average amplitude and average duration of transient events in sheaths that are stabilised (green) or fully retracted (orange).
E. mbp:mCherry-CAAX expressing oligodendrocytes in control (top) and PD150606 treated animal (bottom) at 4 dpf. Scale bar= 10µm. Quantitation in 2H.
F. Frames from time-lapse movies of oligodendrocytes during myelination in a DMSO treated (left) and PD150606 treated (right) animal. Arrowheads point to sheaths that are retracted. See also
G. mbp:meGFP expressing oligodendrocytes (top) and mbp:meGFP-calpastatin (bottom) at 4 dpf. Scale bar= 10µm. Quantitation in 2J.
H. Myelin sheath number per oligodendrocyte in DMSO and PD150606 treated animals (n=18 OLs from 18 DMSO-treated animals; n= 33 OLs from 33 PD150606-treated animals; Graph shows mean and SD. Two-tailed t-test, p=0.006).
I. Rate of myelin sheath retraction per hour in DMSO and PD150606 treated animals as analysed by time-lapse microscopy. (n=14 OLs from 14 DMSO-treated animals and 34 OLs from 34 PD150606-treated animals. Graph shows mean and SD. Two-tailed t-test, p=0.013).
J. Myelin sheath number per mbp:meGFP and mbp:meGFP-calpastatin expressing oligodendrocytes at 4 dpf. (n=31 OLs in 22 mbp:meGFP control animals, and n=29 OLs in 23 mbp:meGFP-calpastatin animals. Graph shows mean and SD. Two-tailed t-test, p=0.0043).