
Figure 4
- ID
- ZDB-IMAGE-190723-324
- Publication
- Seebacher et al., 2019 - Histone deacetylase activity mediates thermal plasticity in zebrafish (Danio rerio)
|
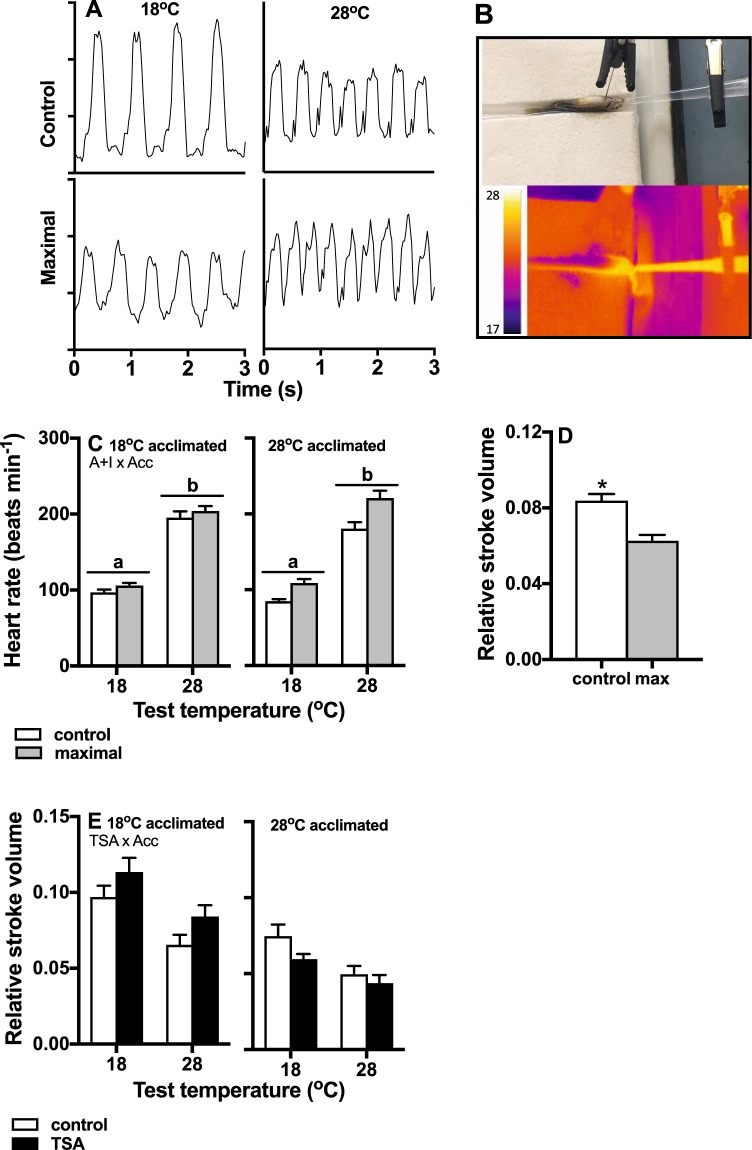
Figure 4
Cardiac responses to TSA, and isoproterenol + atropine treatments which induced maximal heart rates. Example traces showing changes in heart rate and stroke volume with different levels of acute test temperature and A + I treatment (control and maximal) (