
Figure 6—figure supplement 3.
- ID
- ZDB-IMAGE-190723-2693
- Publication
- Jiang et al., 2019 - A conserved morphogenetic mechanism for epidermal ensheathment of nociceptive sensory neurites
- All Figures
- Figures for Jiang et al., 2019
|
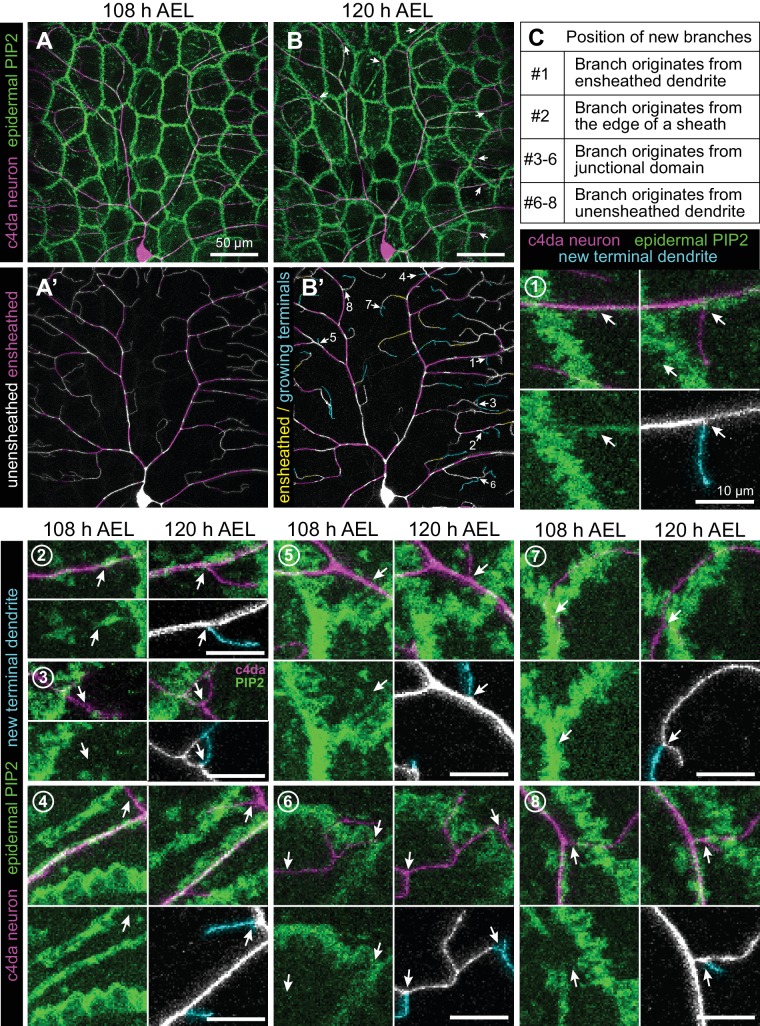
Figure 6—figure supplement 3.
C4da neurons were imaged over a 12 h time-lapse in larvae additionally expressing the epidermal sheath marker PLCδ-PH-GFP. Maximum projections show a representative neuron at 108 h (