
Image
|
Figure Caption
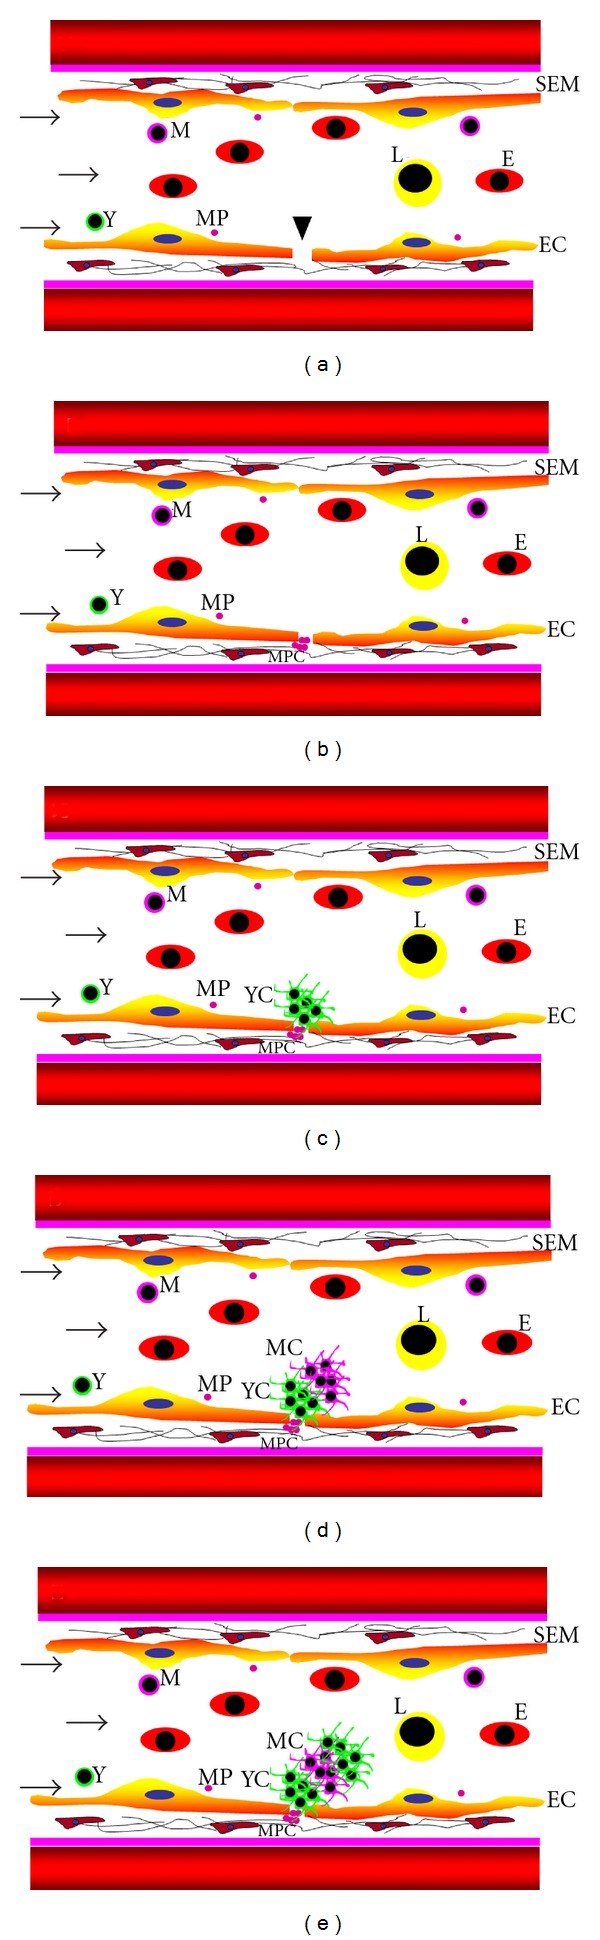
Figure 3
Schematic representation of sequential steps in growing arterial thrombus. Panels (a) through (e) show the sequence of events in thrombus growth. Arrowhead shows the site of laser injury in (a), (b) shows initiation of thrombus with the formation of microparticle (MP) clusters (MPC) followed by young thrombocyte (Y) clusters (YC) shown in (c) and then followed by a mixture of mature thrombocyte (M) clusters (MC) and YC as shown in (d) and (e) EC indicates endothelial cell; SE, subendothelial matrix; (e) erythrocytes; L, leukocytes. Arrows show the direction of blood flow.
Acknowledgments
This image is the copyrighted work of the attributed author or publisher, and
ZFIN has permission only to display this image to its users.
Additional permissions should be obtained from the applicable author or publisher of the image.
Full text @ Adv. Hematol.