IMAGE

Fig. 2

ID
ZDB-IMAGE-190723-1858
Source
Figures for Astone et al., 2017
Image
Figure Caption

Fig. 2

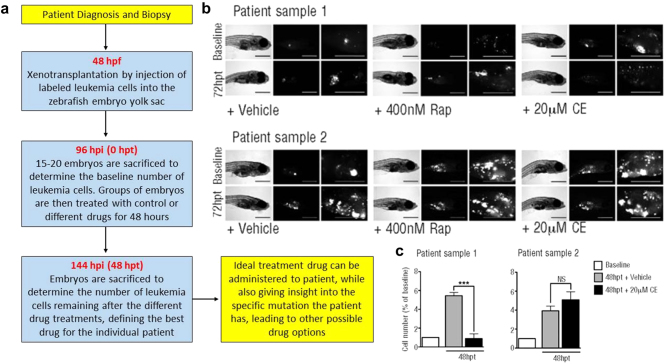
Precision oncology approach to leukemia drug screening using zebrafish. a Flow chart demonstrating the timeline used. Patient-derived leukemia cells were xenotransplanted into zebrafish embryos, which were administered various drugs. Leukemia cell number was used to assess drug efficacy in the zebrafish avatar corresponding to an individual leukemia patient. Assessment of drug efficacy is completed within 8 days, leading to a fast, effective, and individualized cancer treatment. hpf: hours post-fertilization, hpi: hours post-injection of cells, hpt: hours post-treatment. b Bright-field and fluorescence images of zebrafish injected with patient-derived leukemia cells. Embryos were treated with vehicle (control), Rapamycin (Rap) or Compound E (CE). Images were taken at 72 hpt. Scale bars are 500 µM. c A baseline number of leukemia cells was determined at 96 hpi. An increase in the number of leukemia cells when compared to the baseline data demonstrates cell proliferation in the zebrafish model. In patient sample one, data demonstrates a significant (p < 0.0001) response to the Notch inhibition (CE). The patient sample was subsequently sequenced and a gain of function mutation in the Notch pathway was found. Patient sample two did not demonstrate significant results, suggesting the mutation was not in the Notch pathway, which was subsequently confirmed through sequencing. Reproduced with permission and adapted from: Bentley, V.L. et al. Haematologica 100, 70–76 (2015)5

Acknowledgments
This image is the copyrighted work of the attributed author or publisher, and ZFIN has permission only to display this image to its users. Additional permissions should be obtained from the applicable author or publisher of the image. Full text @ NPJ Precis Oncol