
|
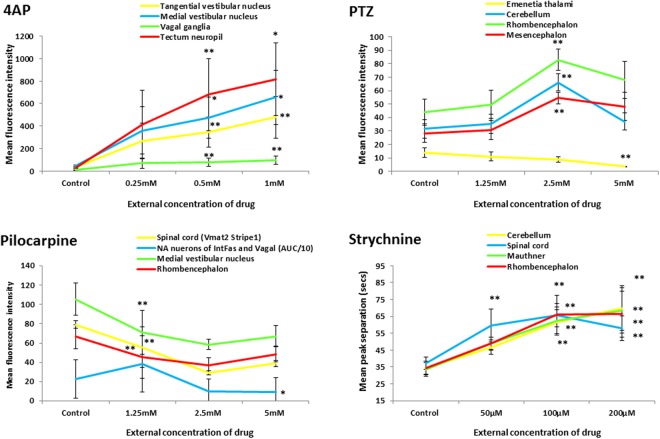
Figure 6
Example concentration response curves generated for selected brain regions of interest in fish exposed to each of the 4 drugs. To provide representative curves, all data shown are those derived from measurements of mean peak fluorescence intensity across all larvae within that treatment group, except pilocarpine noradrendergic (NA) neurons of the interfascicular and vagal areas for which the AUC is presented (divided by 10 to allow plotting on the same axis) and all of the strychnine data (peak separation data shown). Data are shown as the average of the median fluorescence intensity measures obtained for each fish in that treatment group, ±SEM (n = 7–8). All statistical analyses were undertaken using a Kruskal Wallis analysis across treatment groups, followed by a Dunn’s post-hoc test in which each drug-treated group was compared with the corresponding control group. *Denotes significance at the P < 0.05, and **at the P < 0.01 level in order of lines on graph. Strychnine significance levels are shown below each point in order of the legend. For full concentration-response datasets please see Supplementary Table 5.