
|
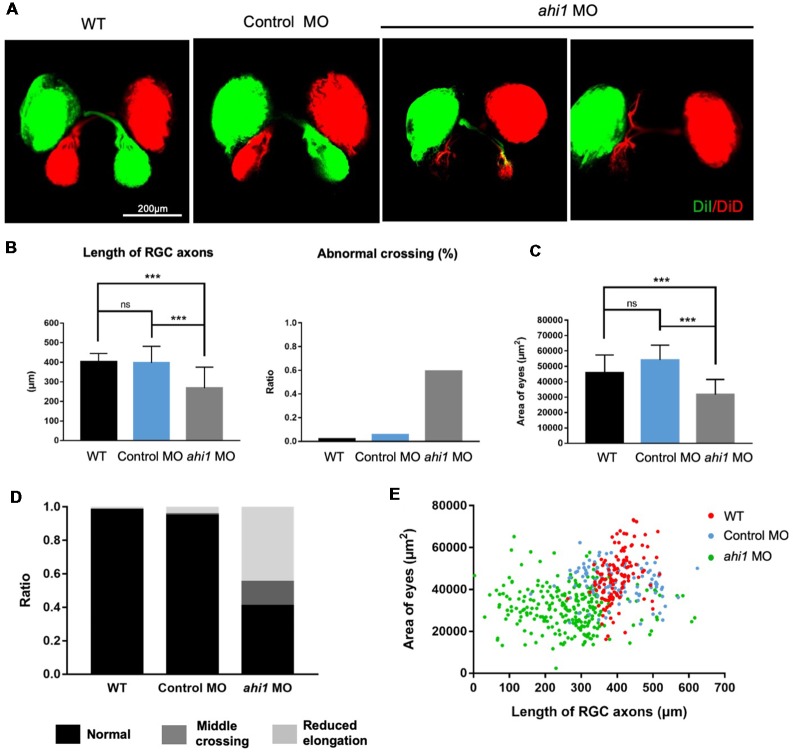
Figure 4
The ahi1 morpholino-injected embryos exhibited retinal ganglion cell (RGC) axon projection defects at 4 dpf. (A) The normal retinotectal projection pattern of WT or control morpholino (Control MO)-injected embryos and defective retinotectal projections in the ahi1 morpholino (ahi1 MO)-injected embryos. Scale bar: 200 μm. (B) The statistical results of the RGC axon length and abnormal middle crossing of WT (n = 106), Control MO- (n = 112), and ahi1 MO- (n = 266) injected embryos. (C) The statistical results of eye sizes of WT and ahi1 MO-injected embryos. (D) The ratios of embryos with normal retinal axon projection (Normal), abnormal middle crossing (Middle crossing), and reduced axon longation (Reduced elongation) in the WT, control MO-, and ahi1 MO-injected embryos. (E) The two-dimensional scatter diagram for eye size in each group. The X-axis represents the length of OT (μm2), and the Y-axis represents the size of eyes (μm2). Error bars denote SEM. ***p < 0.0001 was determined via Student’s t-test.