
Fig. 6
- ID
- ZDB-IMAGE-190718-5
- Publication
- Masud et al., 2019 - Macrophages target Salmonella by Lc3-associated phagocytosis in a systemic infection model
- All Figures
- Figures for Masud et al., 2019
|
Fig. 6
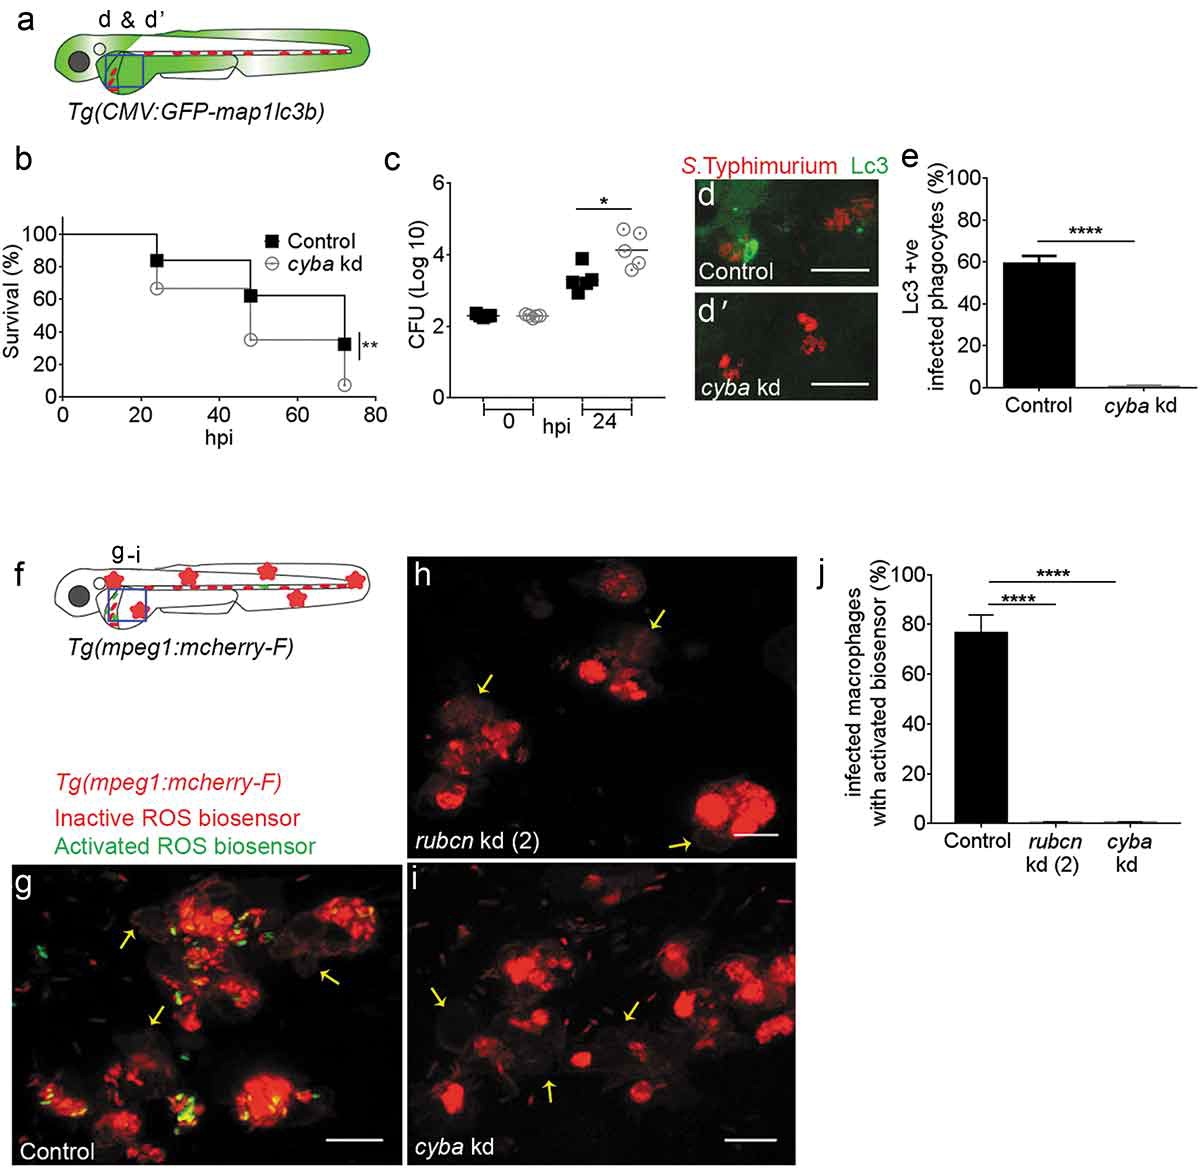
(a) Region of interest (blue square) for confocal image acquisition of infected phagocytes in the blood circulation in d and d’. (b) Survival curves of S. Typhimurium-infected control and cyba knockdown embryos. One representative of three replicates is shown. (c) Representative CFU counts of S. Typhimurium- infected control and cyba knockdown embryos. Five embryos/larvae per time point were used and the log transformed CFU data are shown with the geometric mean per time point. (d) Representative confocal images of control (d) and cyba (d’) knockdown embryos at 4 hpi. (e) Quantification of GFP-Lc3-Salmonella associations in control and cyba knockdown embryos at 4 hpi. Numbers of infected phagocytes positive or negative for GFP-Lc3-Salmonella associations were counted from confocal images and the percentages of Lc3-positive over the total were averaged from five embryos per group. Error bars represent the SD. (f) Region of interest (blue square) for confocal image acquisition of infected phagocytes in the blood circulation of Tg(mpeg1:mCherry-F) embryos in g-i. Red stars symbolize the mCherry-expressing macrophages in the transgenic line used for this experiment. (g-i) Representative confocal images of Tg(mpeg1:mCherry-F)umsF001 embryos at 4 hpi following injection of a Salmonella ROS biosensor strain into control (g), and rubcn kd(2) (h) or cyba morpholino knockdown groups (i). The ROS biosensor strain expresses a constitutive mCherry marker and the GFP signal indicates ROS biosensor activation. Macrophages in the Tg(mpeg1::mCherry-F) line express a farnesylated mCherry protein localizing to membranes (arrows) and therefore the signal is separated from bacterial mCherry signal. (j) Quantification of ROS biosensor activation at 4 hpi in control, rubcn kd(2) and cyba morpholino knockdown groups of Tg(mpeg1::mCherryF) embryos at 4 hpi. Numbers of macrophages showing ROS biosensor activation (GFP and mCherry bacterial signals) or without ROS biosensor activation (mCherry bacterial signal only) were counted from confocal images and the percentages of ROS biosensor-positive over the total were averaged from five embryos per group. Error bars represent the SD. Scale bars: 10 μm. ****P < 0.0001, **P < 0.01, *P < 0.1.