
Fig. S3
- ID
- ZDB-IMAGE-190716-7
- Publication
- Han et al., 2019 - Vitamin D Stimulates Cardiomyocyte Proliferation and Controls Organ Size and Regeneration in Zebrafish
- All Figures
- Figures for Han et al., 2019
|
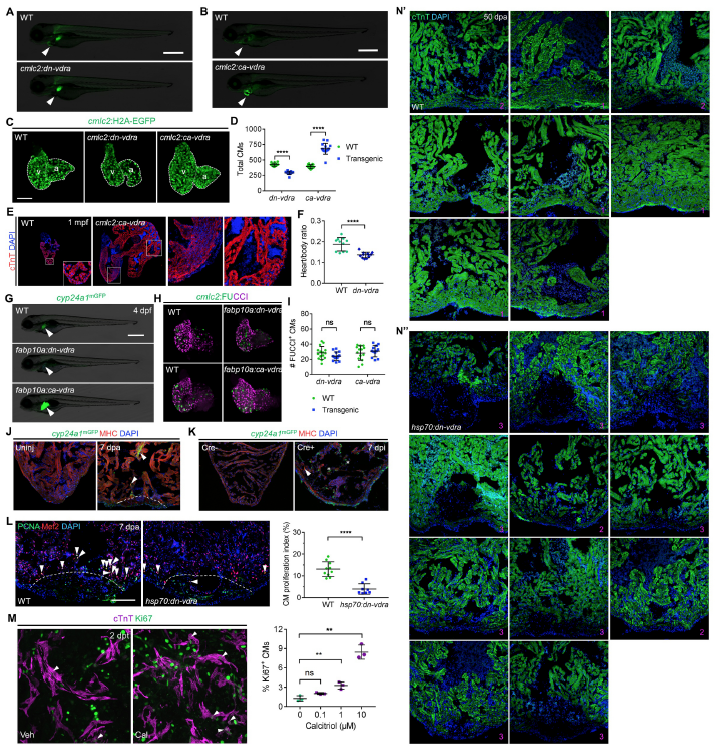
Fig. S3
Regulation of Cardiomyocyte Proliferation and Heart Regeneration by
Vitamin D (Related to Figure 3)
(A) Lateral view of cyp24a1mGFP expression in 4 dpf wild-type (WT) and cmlc2:dn-vdra
sibling embryos. The image acquisition exposure was increased for both genotypes to
better visualize cardiac expression (arrowheads). Scale bar, 500 μm.
(B) Lateral view of cyp24a1mGFP expression in 4 dpf WT and cmlc2:ca-vdra sibling
embryos. Images were merged with dim brightfield images to indicate whole embryos.
Arrowheads indicate hearts. Scale bar, 500 μm.
(C) Representative maximum projection images of dissected hearts from 4 dpf
cmlc2:H2A-EGFP larvae in WT, cmlc2:dn-vdra and cmlc2:ca-vdra backgrounds. Scale
bar, 50 μm.
(D) Quantification of CM numbers from hearts of WT, cmlc2:dn-vdra and cmlc2:ca-vdra
embryos. ****p < 0.0001. n = 15 for all groups.
(E) Maximum intensity projection images of cTnT expression in 1 mpf WT and cmlc2:cavdra
hearts. Boxed regions were enlarged in inset or on the right side. Note the massive
growth of both ventricular and atrial cardiomyoctes in cmlc2:ca-vdra hearts.
(F) Quantification of 2 mpf WT and cmlc2:dn-vdra heart-to-body ratio. The ratio was
calculated as area of ventricle (mm2) divides body length (mm). ****p < 0.0001. n = 11,
12 respectively.
(G) Lateral view of cyp24a1mGFP expression in 4 dpf WT, fabp10a:dn-vdra, and
fabp10a:ca-vdra embryos. Note the images were merged with brightfield images to
indicate whole embryos. Arrowheads indicate livers. Scale bar, 500 μm.
(H) Maximum intensity projection images of dissected 4 dpf cmlc2:FUCCI hearts from
fabp10a:dn-vdra or fabp10a:ca-vdra and their wild-type siblings. Scale bar, 50 μm.
(I) Quantification of FUCCI+ CMs for experiments in b. n=15, 14, 14, 12, respectively. ns,
not significant.
(J) Maximum intensity projection images of uninjured and 7 dpa hearts of cyp24a1mGFP
reporter. Arrowheads indicate expression in cardiomyocytes.
(K) Maximum intensity projection images of MHC staining for cyp24a1mGFP reporter
crossed with Z-CAT fish at 7 days post tamoxifen treatment (dpi). Arrowhead indicates
expression in cardiomyocytes and asterisks indicate expression in endocardial cells.
(L) Representative images and quantification of Mef2+PCNA+ nuclei versus total Mef2+
nuclei from wild-type or hsp70:dn-vdra zebrafish at 7 dpa after heat-shock induction
protocols, indicating reduced CM proliferation during heart regeneration. Dashed lines
represent amputation planes. n = 10, 8, respectively. ****p < 0.0001. Scale bar, 100 μm.
(M) Representative images and quantification of proliferation of early postnatal (P7)
mouse CMs cultured and treated with vehicle or calcitriol for 72 hours. cTnT is a marker
of CMs and Ki67 is a nuclear marker of cell proliferation. Arrowheads indicate Ki67+ CM
nuclei. Three biological replicate experiments were performed with three technical
repeats for each concentration. ns, not significant; **p < 0.01.
(N) Confocal images of injured ventricles stained for cTnT (CM) expression from wildtype
(N’) or hsp70:dn-vdra (N’’) zebrafish at 50 dpa following daily heat-shocks
beginning at 6 dpa. n = 8, 11, respectively. Magenta numbers at the bottom right
corners are regeneration scores for Figure 3J.
Reprinted from Developmental Cell, 48(6), Han, Y., Chen, A., Umansky, K.B., Oonk, K.A., Choi, W.Y., Dickson, A.L., Ou, J., Cigliola, V., Yifa, O., Cao, J., Tornini, V.A., Cox, B.D., Tzahor, E., Poss, K.D., Vitamin D Stimulates Cardiomyocyte Proliferation and Controls Organ Size and Regeneration in Zebrafish, 853-863.e5, Copyright (2019) with permission from Elsevier. Full text @ Dev. Cell