
Fig. 4
- ID
- ZDB-IMAGE-190716-35
- Publication
- Thomas et al., 2019 - Distinct progenitor populations mediate regeneration in the zebrafish lateral line
- All Figures
- Figures for Thomas et al., 2019
|
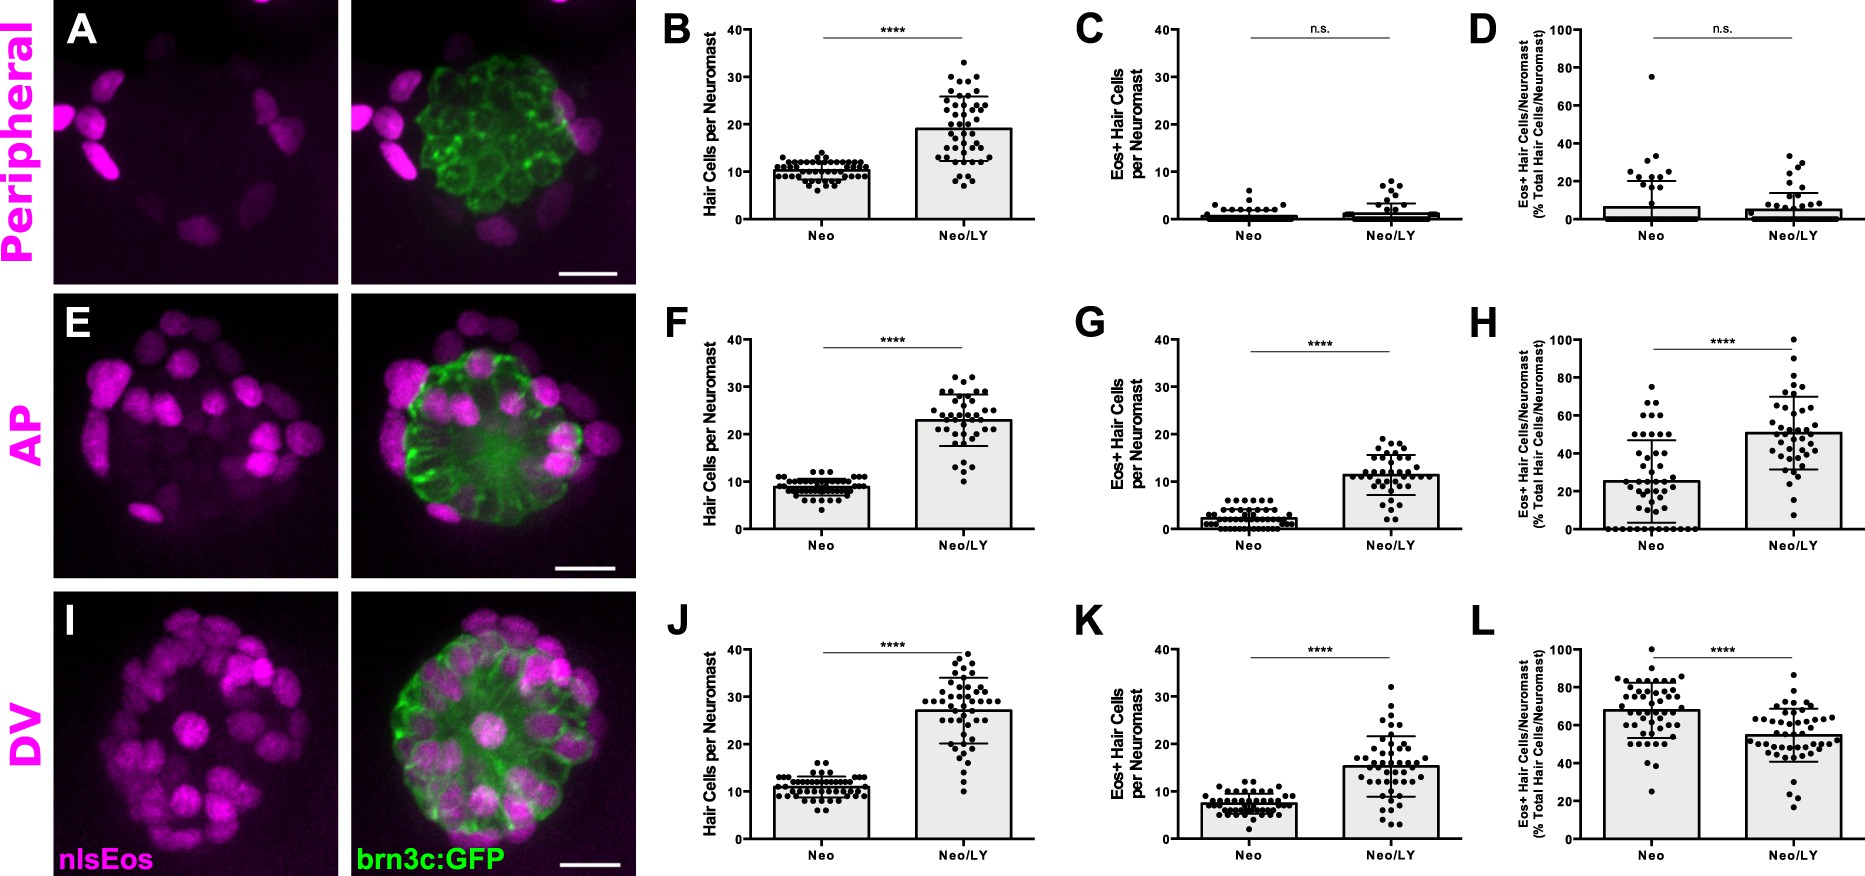
Fig. 4
Notch signaling differentially regulates support cell populations.
(A, E, I) Maximum projections of neuromasts expressing sfrp1a:nlsEos (Peripheral, A), tnfsf10l3:nlsEos (AP, E), and sost:nlsEos (DV, I) following Notch-inhibited hair cell regeneration. Converted nlsEos-positive cells are shown in magenta, and brn3c:GFP-positive hair cells are shown in green. Scale bar = 10 μm. (B) Total number of hair cells per neuromast in sfrp1a:nlsEos fish following hair cell regeneration. Neo: 10.28 ± 1.88, n = 50 neuromasts (10 fish); Neo/LY: 19.07 ± 6.79, n = 46 neuromasts (10 fish); mean ± SD; Mann Whitney U test, p<0.0001. (C) Sfrp1a:nlsEos-positive hair cells per neuromast following hair cell regeneration. Neo: 0.62 ± 1.28, n = 50 neuromasts (10 fish); Neo/LY: 1.15 ± 2.16, n = 46 neuromasts (10 fish); mean ± SD; Mann Whitney U test, p=0.2481. (D) Percentage of sfrp1a:nlsEos-labeled hair cells per neuromast following hair cell regeneration. Neo: 6.31 ± 13.83, n = 50 neuromasts (10 fish); Neo/LY: 4.95 ± 8.82, n = 46 neuromasts (10 fish); mean ± SD; Mann Whitney U test, p=0.5148. (F) Total number of hair cells per neuromast in tnfsf10l3:nlsEos fish following hair cell regeneration. Neo: 8.84 ± 1.75, n = 50 neuromasts (10 fish); Neo/LY: 22.93 ± 5.45, n = 40 neuromasts (eight fish); mean ± SD; Mann Whitney U test, p<0.0001. (G) Tnfsf10l3:nlsEos-positive hair cells per neuromast following hair cell regeneration. Neo: 2.22 ± 1.94, n = 50 neuromasts (10 fish); Neo/LY: 11.38 ± 4.23, n = 40 neuromasts (eight fish); mean ± SD; Mann Whitney U test, p<0.0001. (H) Percentage of tnfsf10l3:nlsEos-labeled hair cells per neuromast following hair cell regeneration. Neo: 25.19 ± 21.72, n = 50 neuromasts (10 fish); Neo/LY: 50.68 ± 19.23, n = 40 neuromasts (eight fish); mean ± SD; Mann Whitney U test, p<0.0001. (J) Total number of hair cells per neuromast in sost:nlsEos fish following hair cell regeneration. Neo: 10.94 ± 2.23, n = 50 neuromasts (10 fish); Neo/LY: 27.06 ± 6.90, n = 48 neuromasts (10 fish); mean ± SD; Mann Whitney U test, p<0.0001. (K) Sost:nlsEos-positive hair cells per neuromast following hair cell regeneration. Neo: 7.40 ± 2.13, n = 50 neuromasts (10 fish); Neo/LY: 15.25 ± 6.36, n = 48 neuromasts (10 fish); mean ± SD; Mann Whitney U test, p<0.0001. (L) Percentage of sost:nlsEos-labeled hair cells per neuromast following hair cell regeneration. Neo: 67.86 ± 14.63, n = 50 neuromasts (10 fish); Neo/LY: 54.69 ± 14.01, n = 48 neuromasts (10 fish); mean ± SD; Mann Whitney U test, p<0.0001.