
Fig. 3
- ID
- ZDB-IMAGE-190716-11
- Publication
- Wu et al., 2019 - Liposome-Mediated Drug Delivery in Larval Zebrafish to Manipulate Macrophage Function
- All Figures
- Figures for Wu et al., 2019
|
Fig. 3
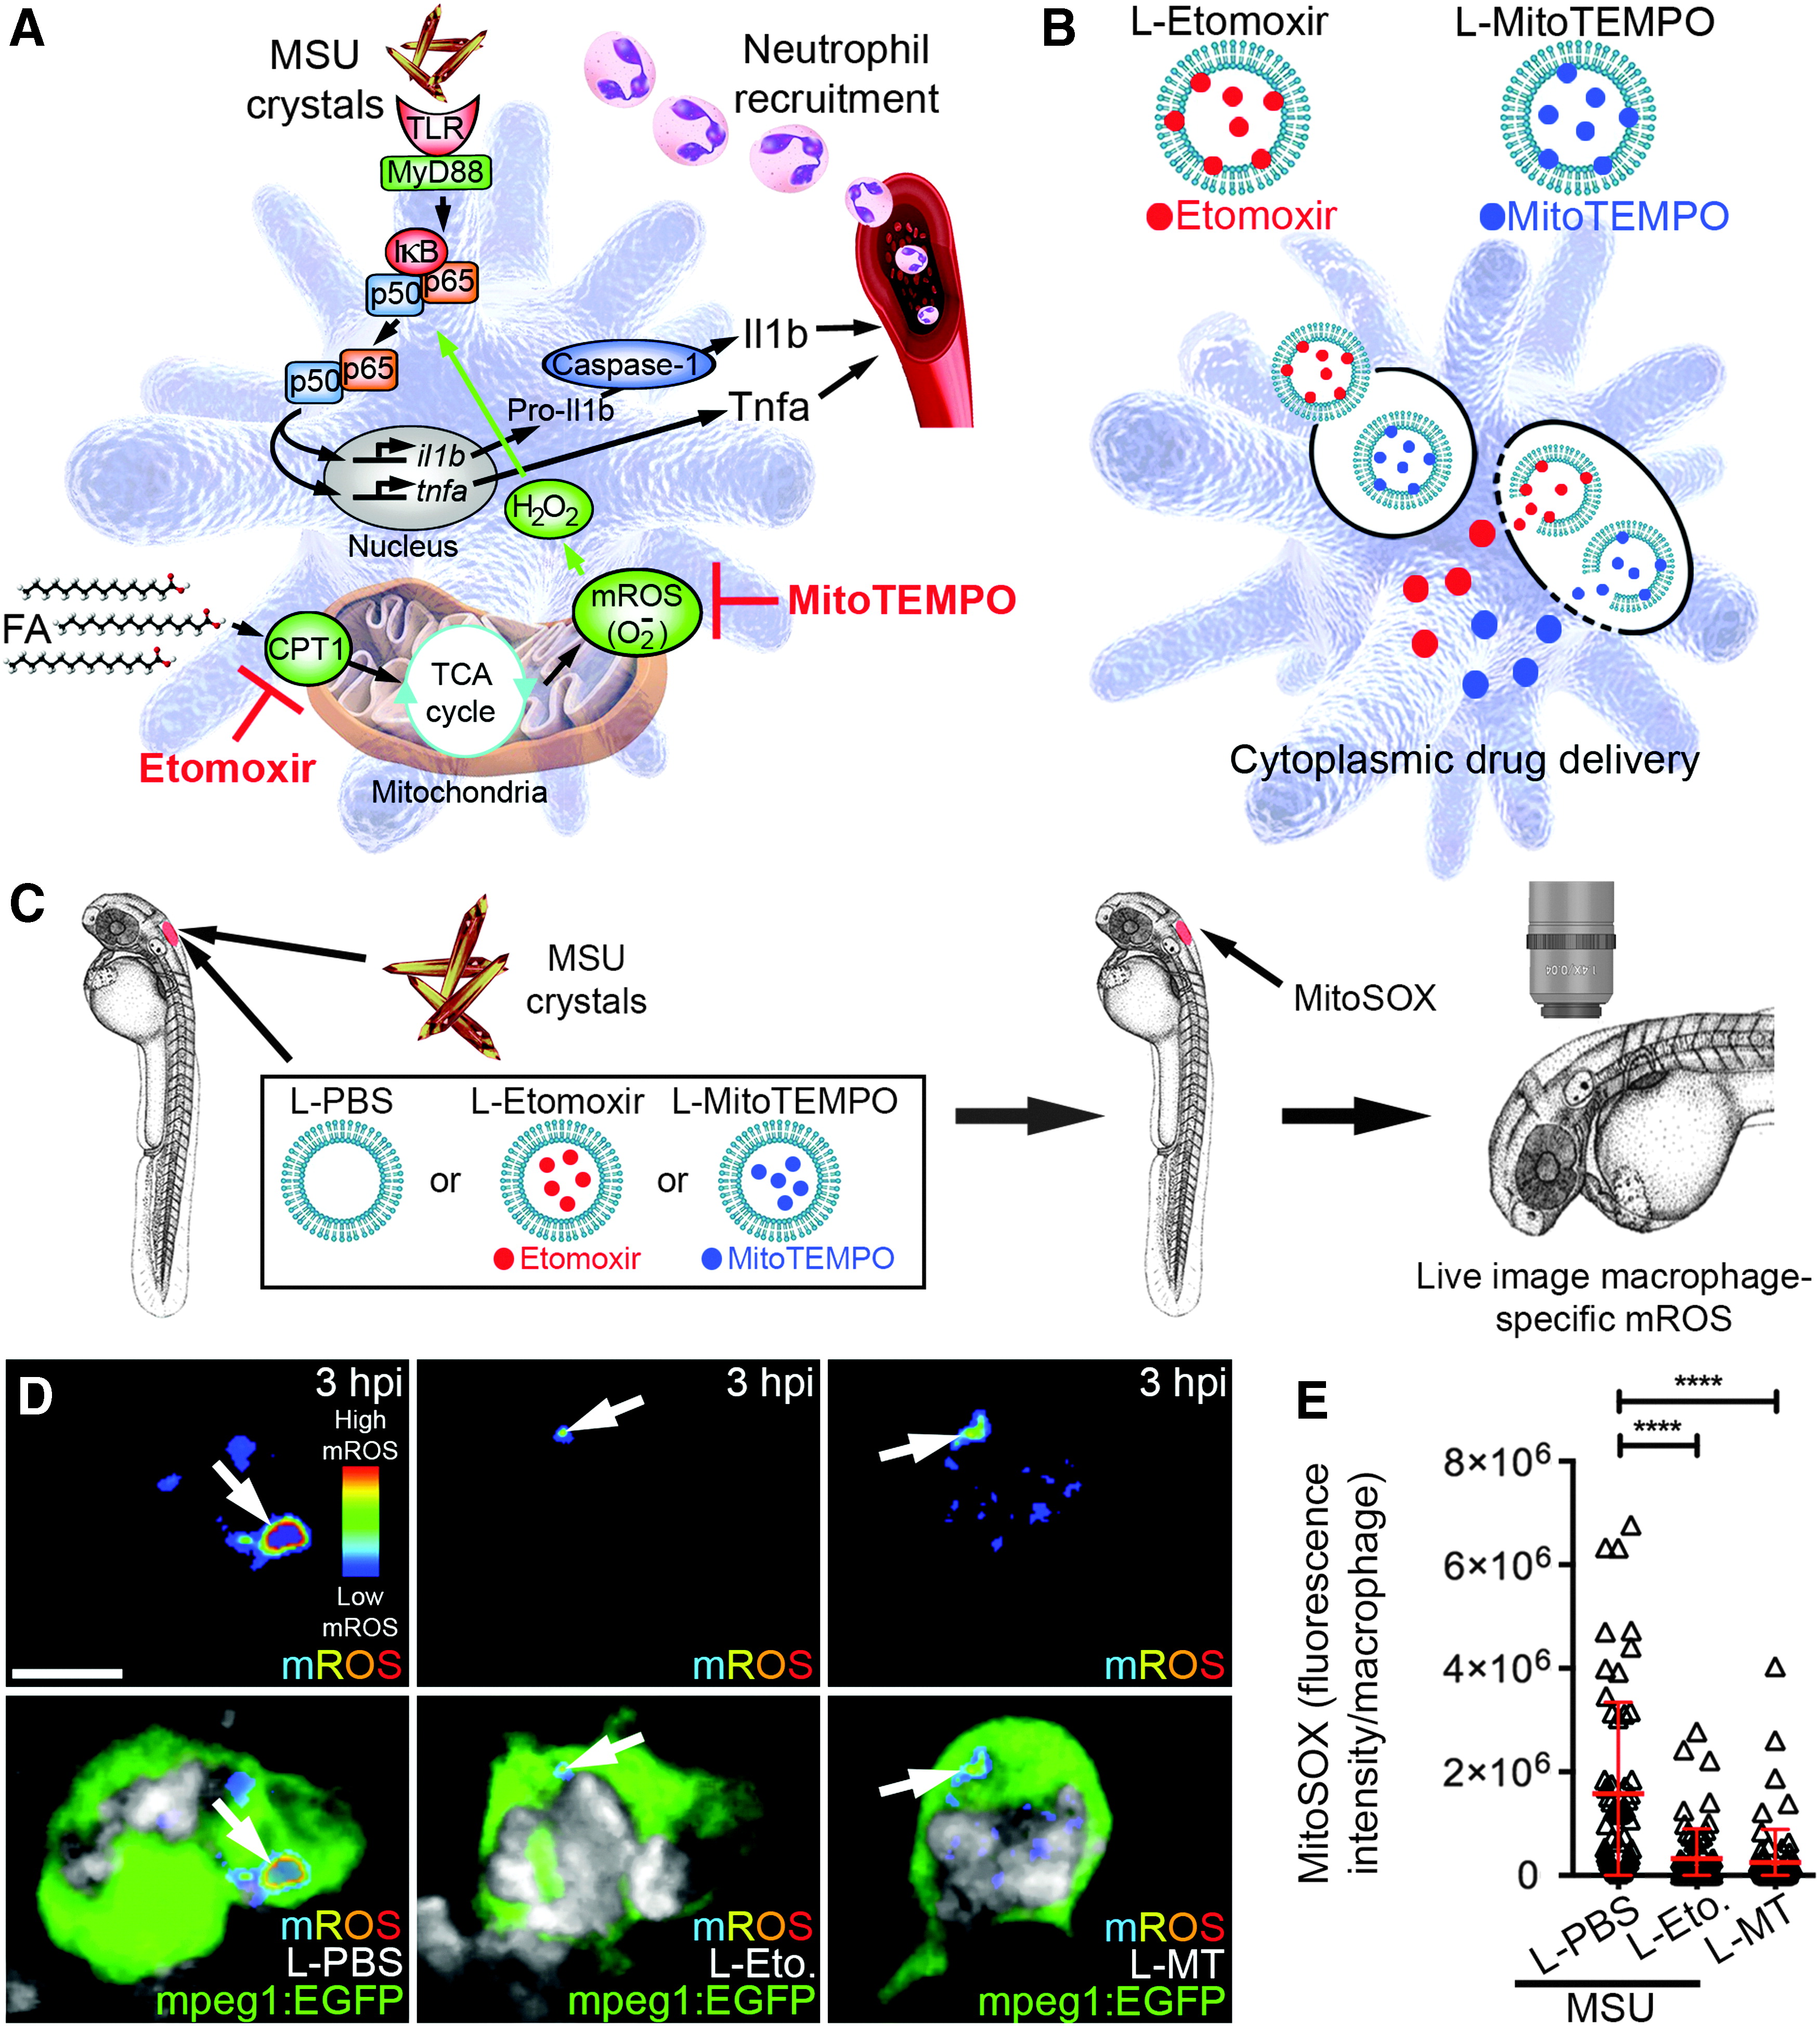
Liposomal etomoxir and MitoTEMPO suppress MSU crystal-driven mROS production in macrophages. (A) Schematic of immunometabolic mechanism of macrophage activation in response to MSU crystals and targets for etomoxir and MitoTEMPO activity. (B)Strategy to target etomoxir and MitoTEMPO to macrophages using liposomal formulations (L-Etomoxir and L-MitoTEMPO). (C) Schematic illustrating delivery of MSU crystals with liposomes and subsequent live imaging of mROS. (D) Live imaging of macrophage-specific mROS production (white arrows) within (mpeg1:EGFP) larvae co-injected with MSU crystals and liposomal PBS (L-PBS), etomoxir (L-Etomoxir/L-Eto.), or MitoTEMPO (L-MitoTEMPO/L-MT), at 3 hpi (MitoSOX signal is displayed as a heatmap with warmer colors representing higher levels of mROS). Marina Blue-labeled liposomes are pseudocolored in grayscale. (E)Quantification of macrophage-specific mROS production, as detected in (D). Error bars display mean ± SD. ****p < 0.0001, one-way ANOVA, Dunnett's post hoc test. Scale bar, 10 μm in (D). mROS, mitochondrial reactive oxygen species.