
|
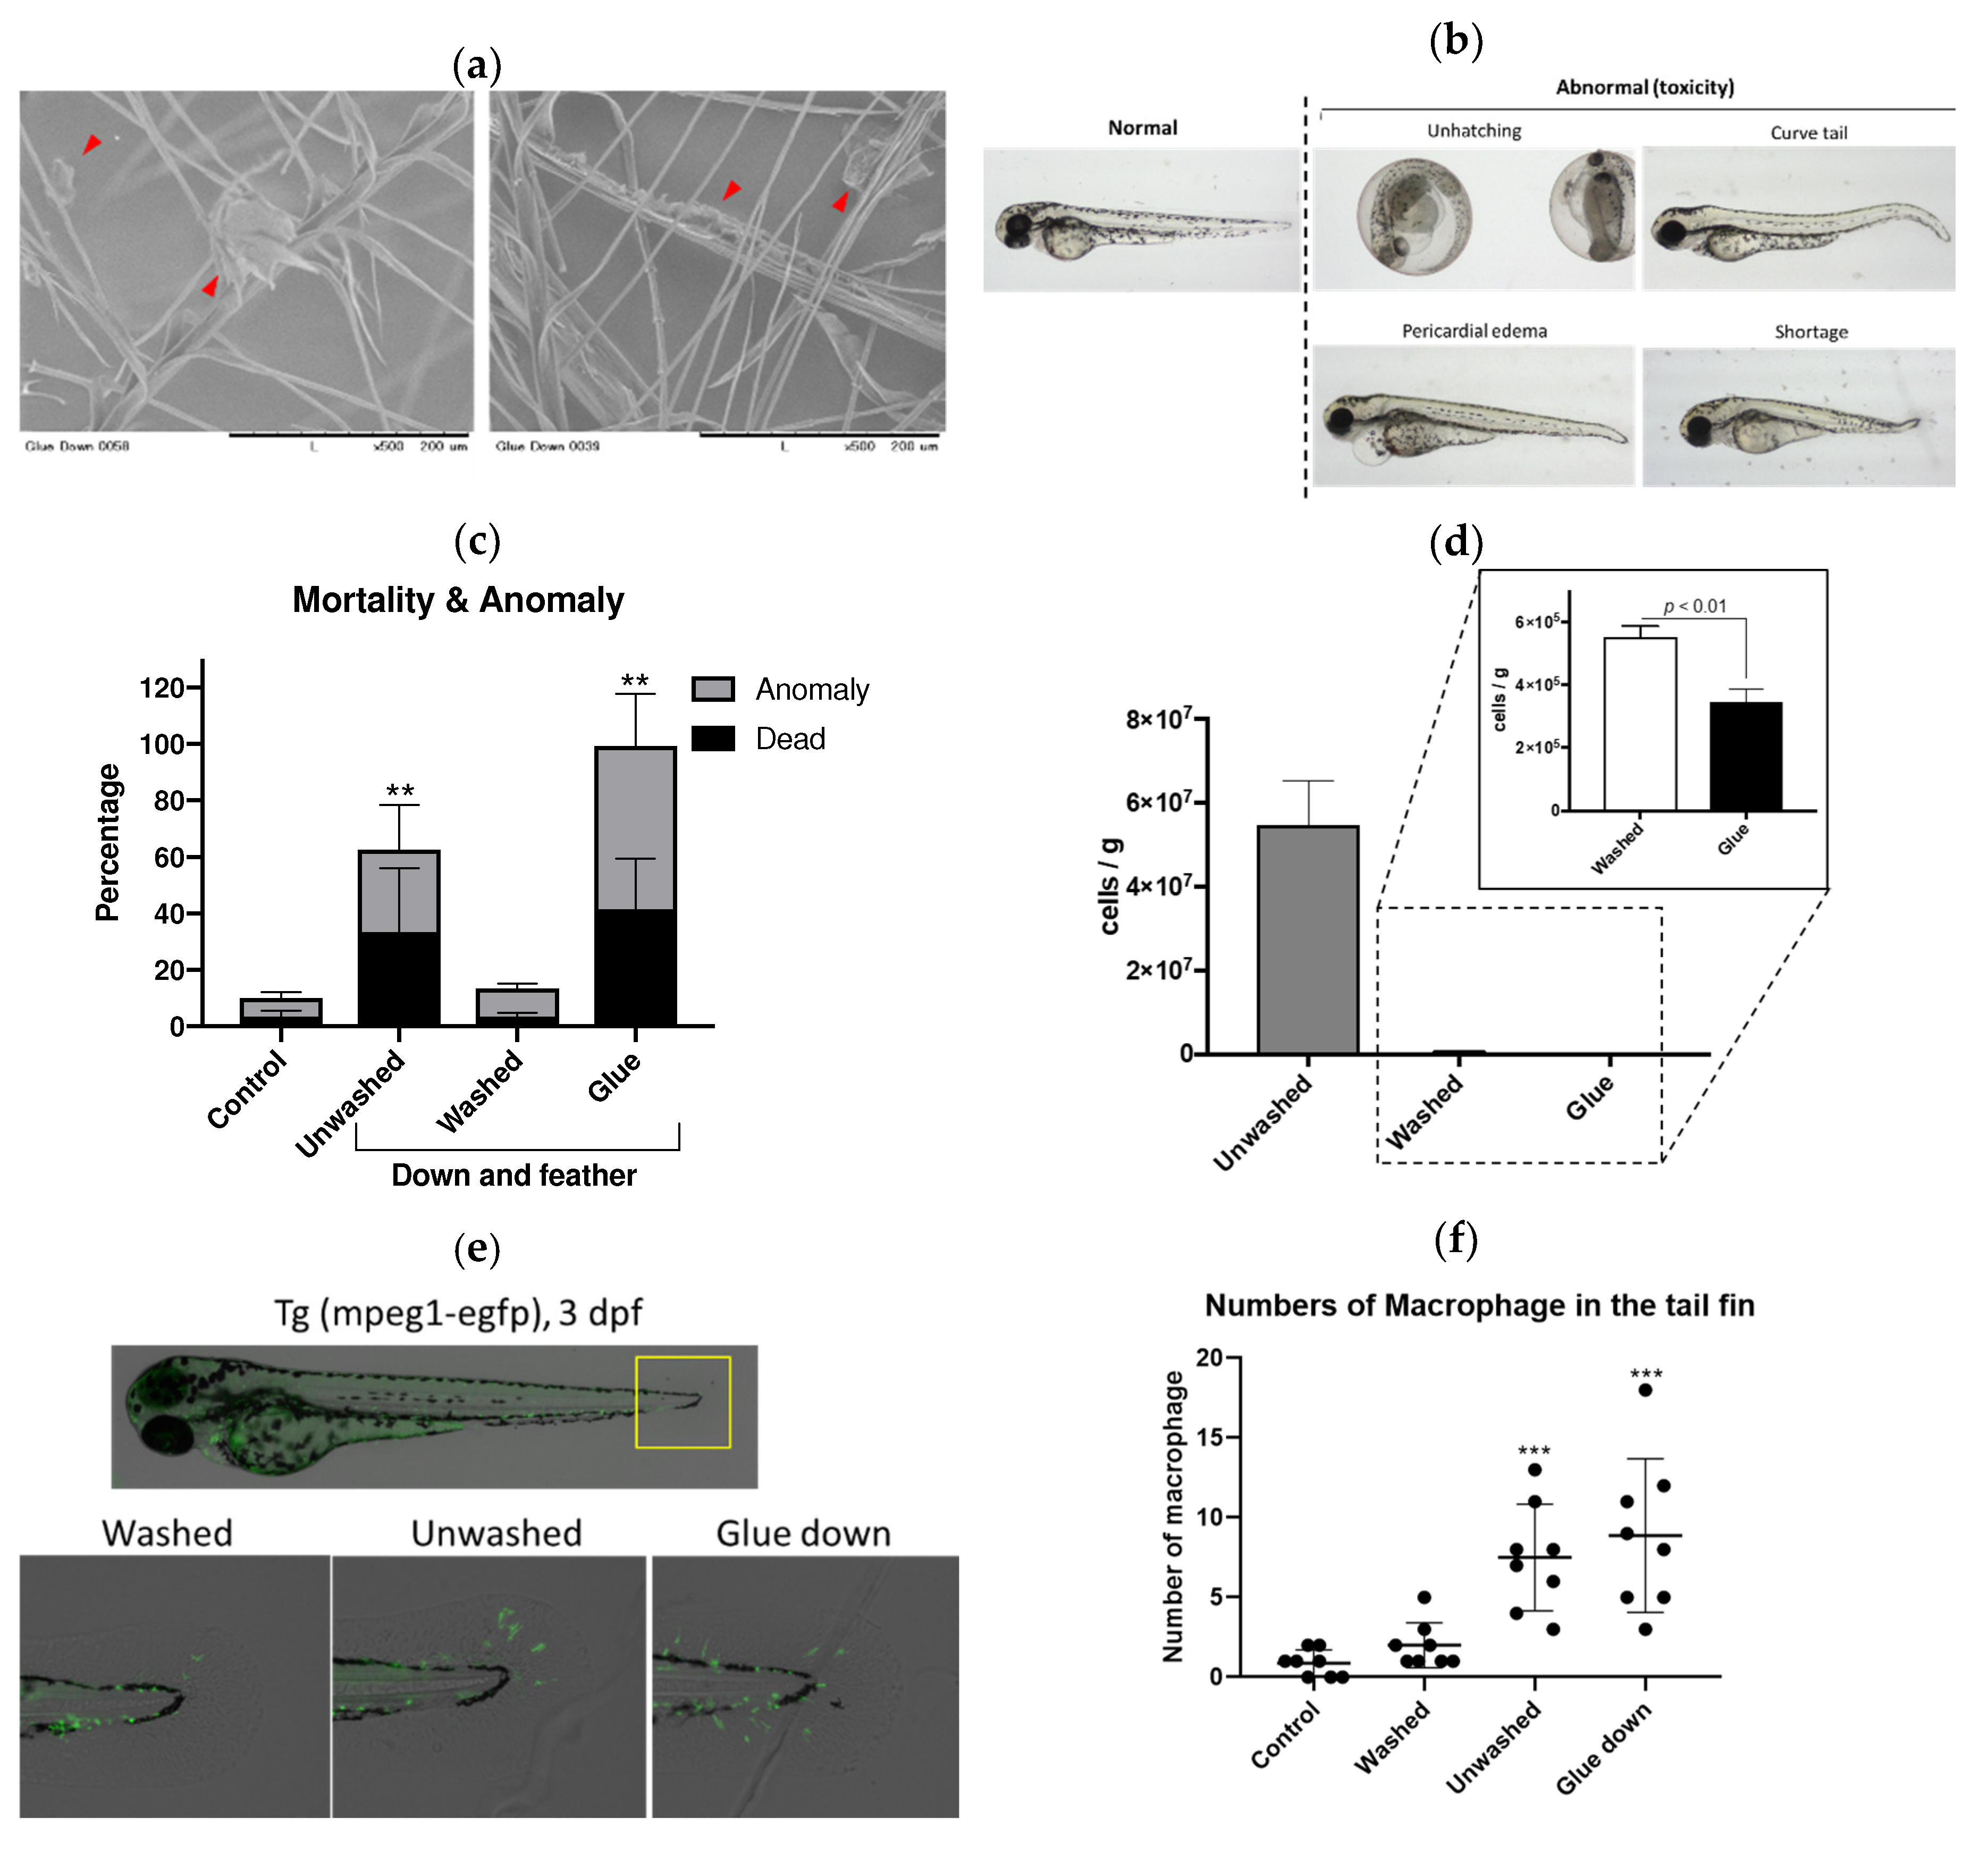
Fig. 3
Zebrafish embryo toxicity test (ZFET) of down and feather samples. (a) Scanning electron microscopic images of glue down. Red arrowheads indicate glue chemicals. (b) Representative images of 72 hours-post-fertilization (hpf) zebrafish in ZFET. (c) Survivals and anomalies in ZFET. ** p < 0.01 vs. control. n = 4–6, error bars indicate SD. (d) Quantification of contaminated bacterial in down and feather samples used in ZFET. n = 4, error bars indicate SD. (e) Representative images of macrophage-EGFP zebrafish used in ZFET. Green indicates EGFP-expressed macrophages. Unwashed and glue down immersion water were diluted 5 times to reduce mortality. (f) Quantification of numbers of macrophages in the tail fin. *** p < 0.001 vs. control. n = 8, error bars indicate SD.