
Image
|
Figure Caption
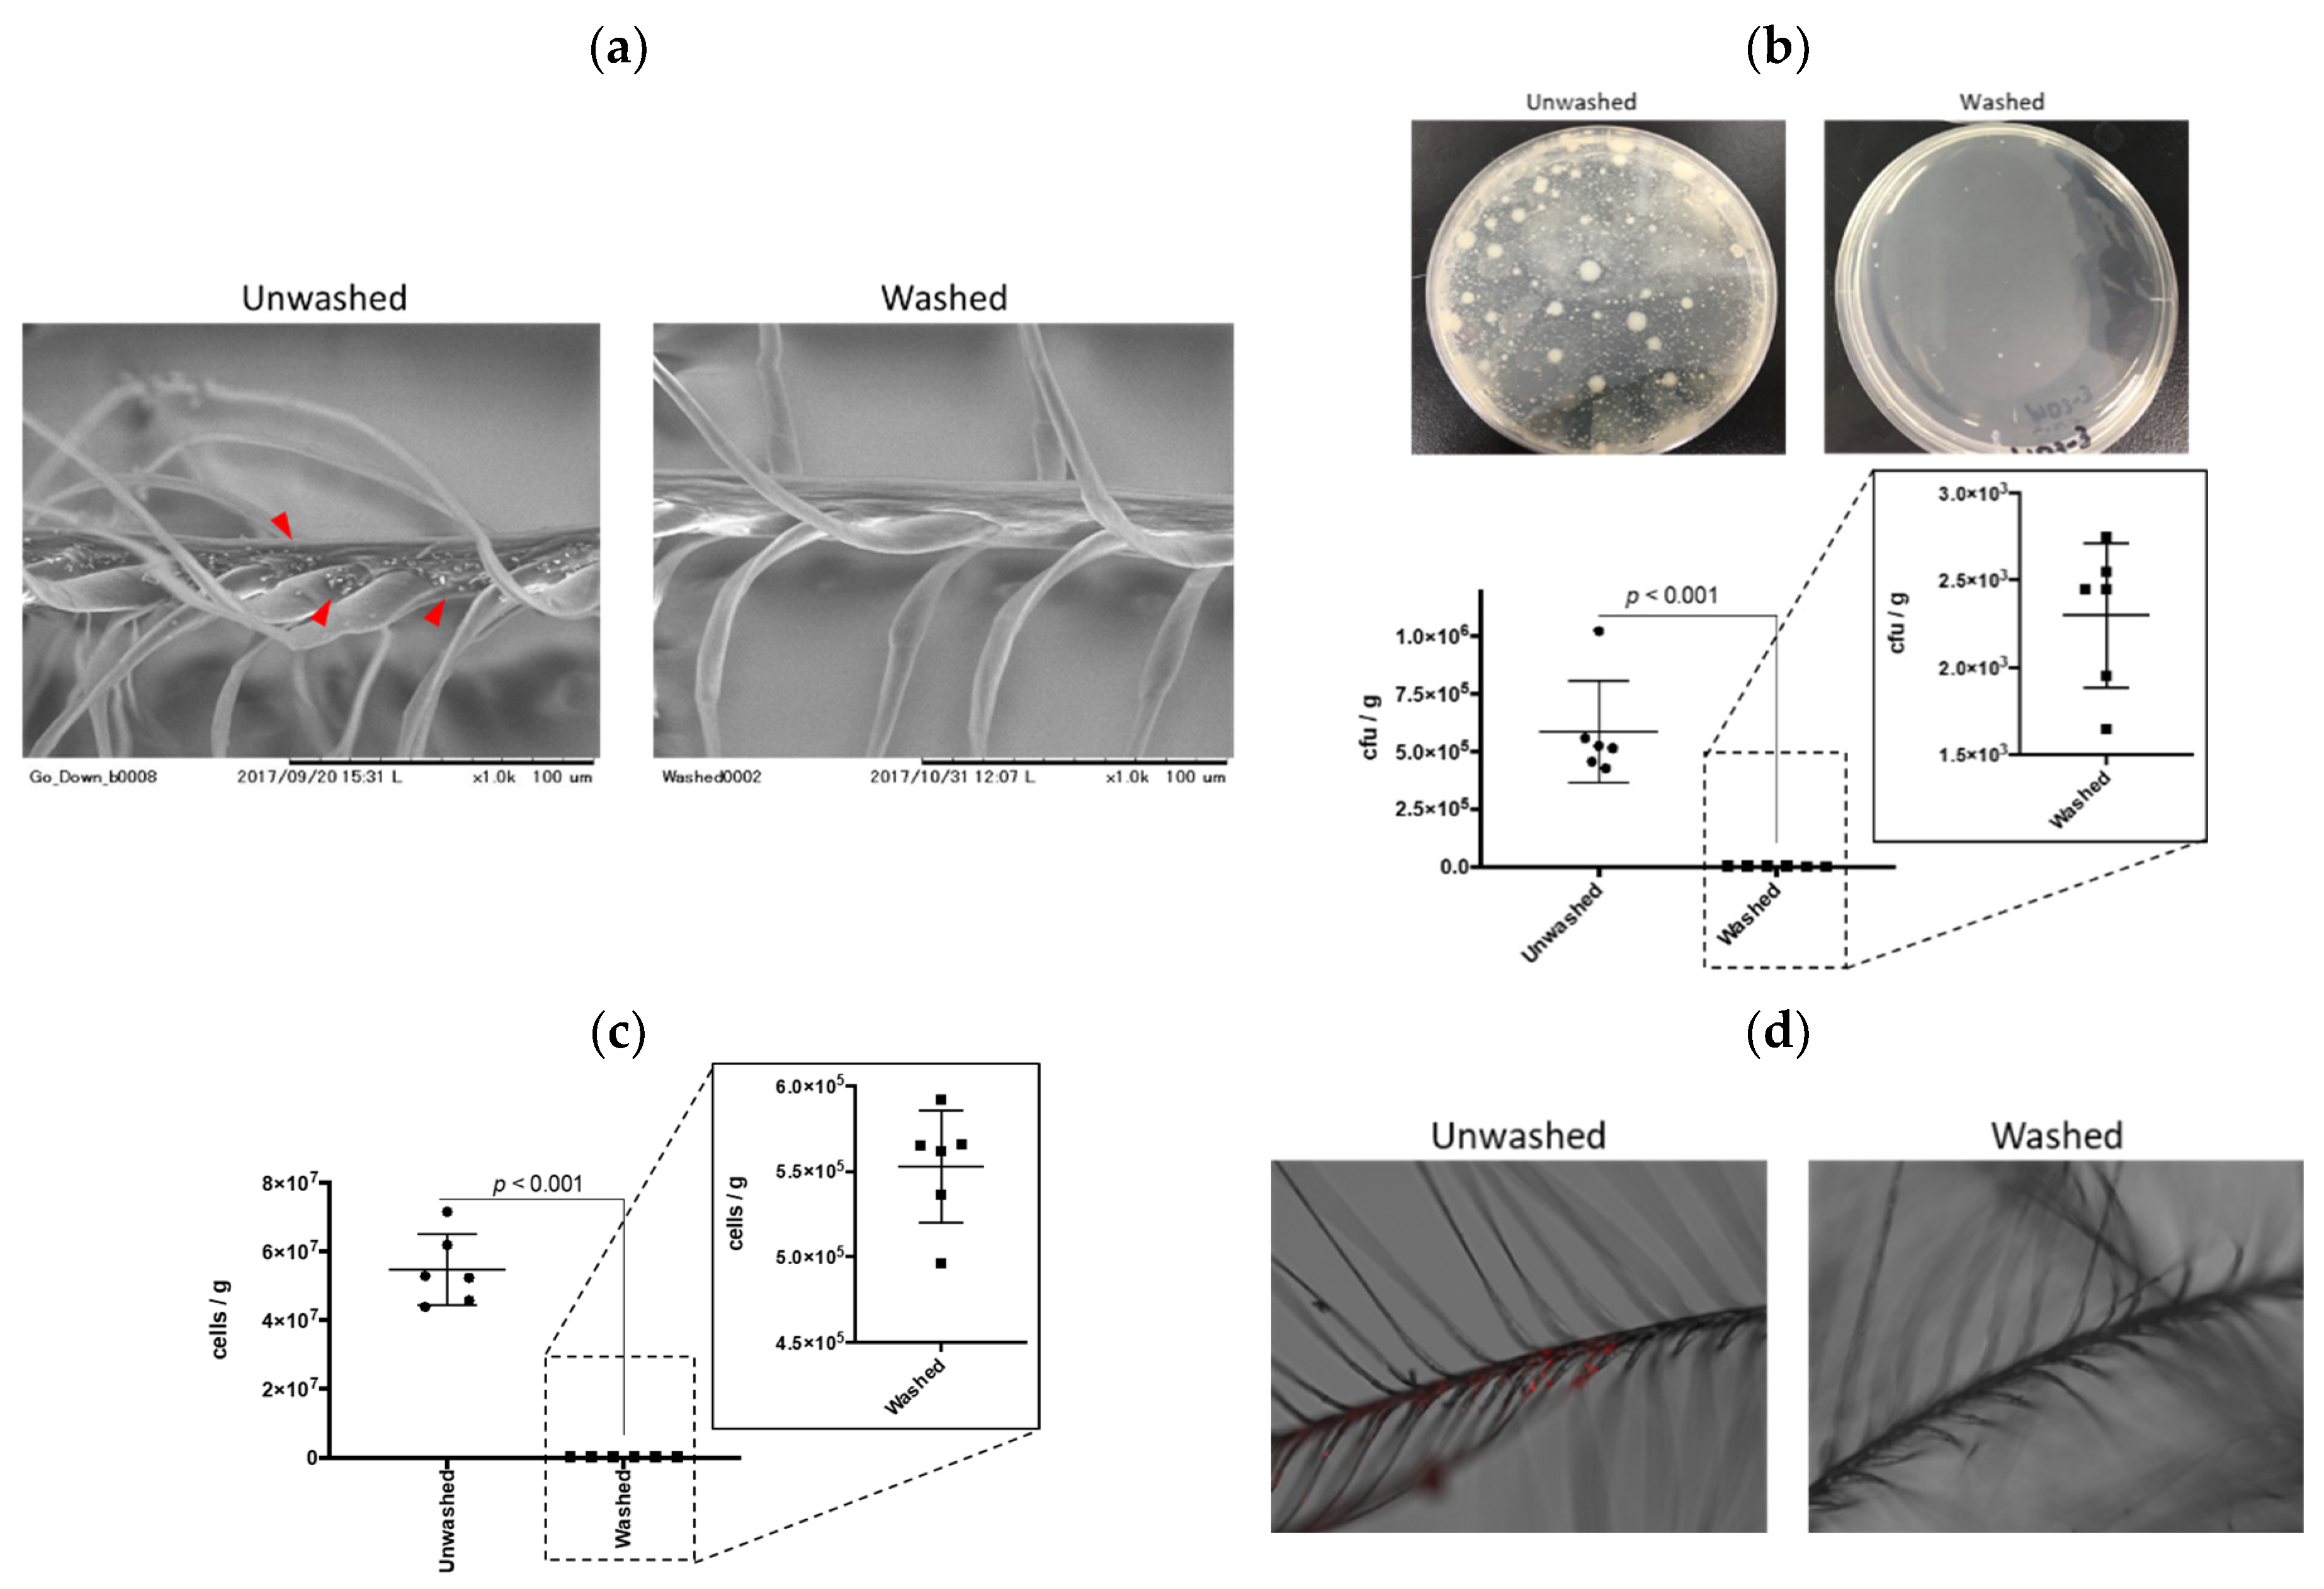
Fig. 1
qPCR quantification of contaminated bacteria in down and feather samples. (a) Scanning electron microscopic images of unwashed and washed down and feather. Red arrowheads indicate debris. (b) Colony-forming unit (CFU) of down and feather samples. CFU was calculated using standard agar plate protocol. n = 6, error bars indicate SD. (c) qPCR analysis of bacterial numbers in down and feather samples. n = 6, error bars indicate SD. (d) Bacterial proliferation in the down and feather samples. Red signal indicates mCherry-expressing E. coli.
Acknowledgments
This image is the copyrighted work of the attributed author or publisher, and
ZFIN has permission only to display this image to its users.
Additional permissions should be obtained from the applicable author or publisher of the image.
Full text @ Int. J. Mol. Sci.