
|
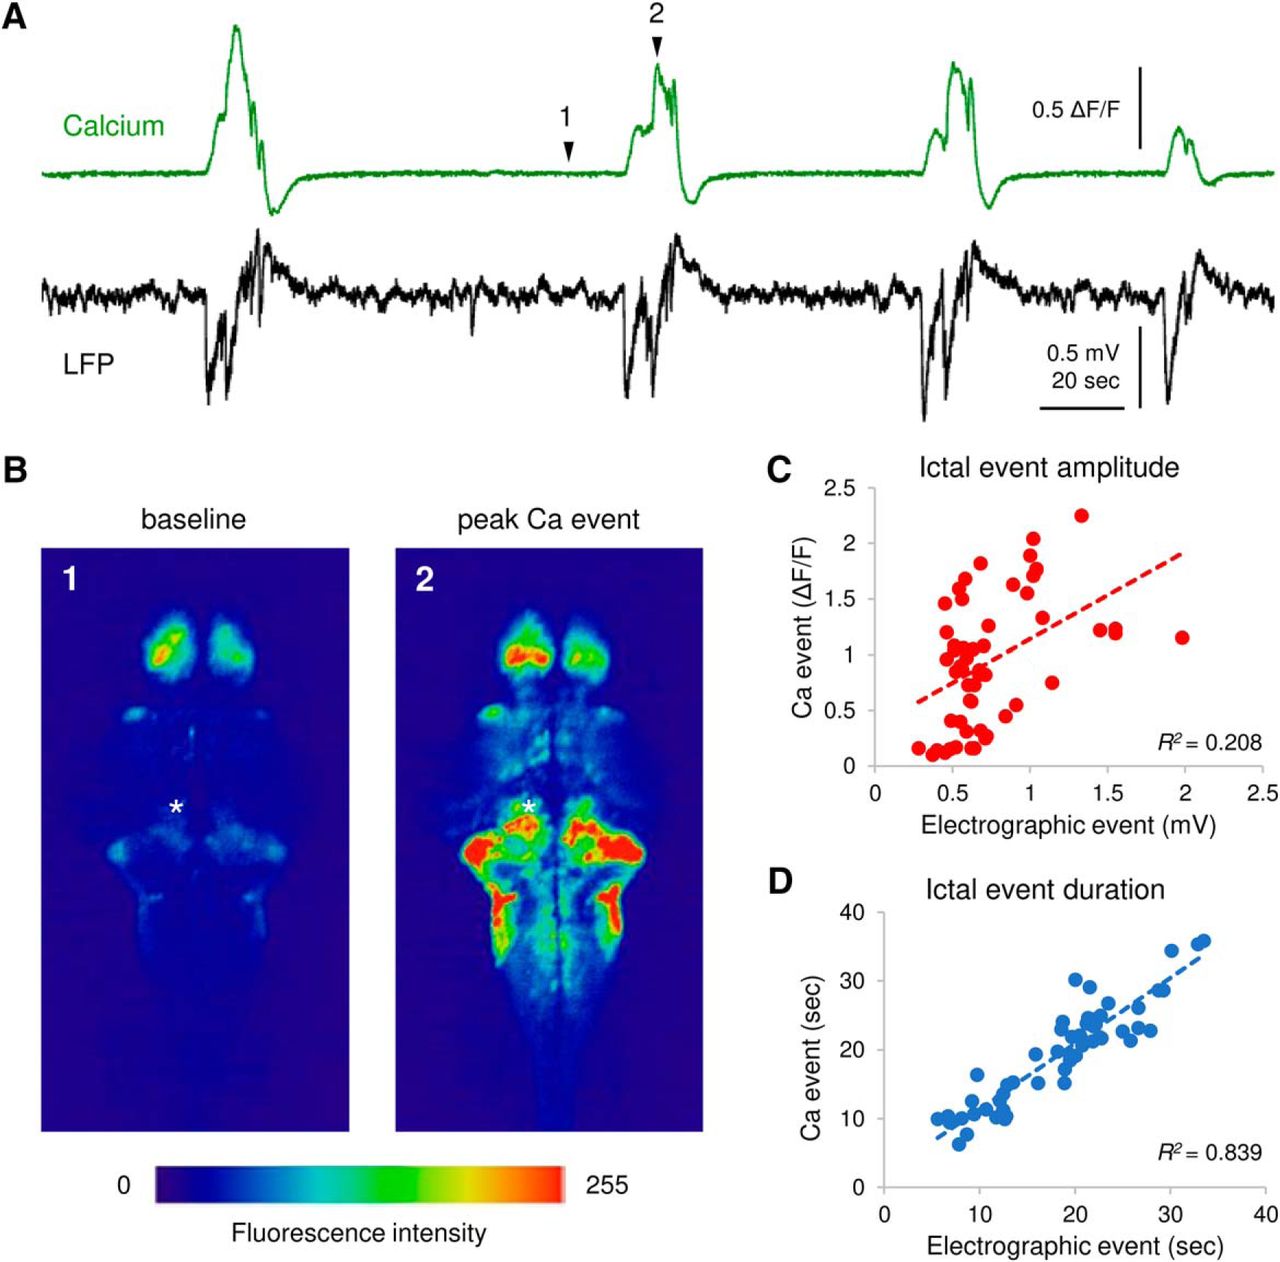
Fig. 2
Correlation between LFP and calcium transients. A, Representative simultaneous calcium traces (green) from the cerebellum and LFP (black) recorded from optic tectum/cerebellum with recurrent PTZ-induced ictal-like seizures. Scale bars as indicated in figure. B, Fluorescence images of calcium activity during baseline and peak ictal-like event. The intensity of fluorescence is color coded as shown in the color bar. Events 1 and 2 as noted in A. Asterisk indicates the LFP recording site. C, D, Correlation between LFP and calcium transients in ictal-like event amplitude (C) and duration (D). Corresponding correlation coefficient R 2 is indicated in figure; n = 54 events from 10 PTZ-treated larvae.