
Fig. 4
- ID
- ZDB-IMAGE-190712-15
- Genes
- Antibodies
- Publication
- Kim et al., 2019 - Distribution and neuronal circuit of spexin 1/2 neurons in the zebrafish CNS
- All Figures
- Figures for Kim et al., 2019
|
Fig. 4
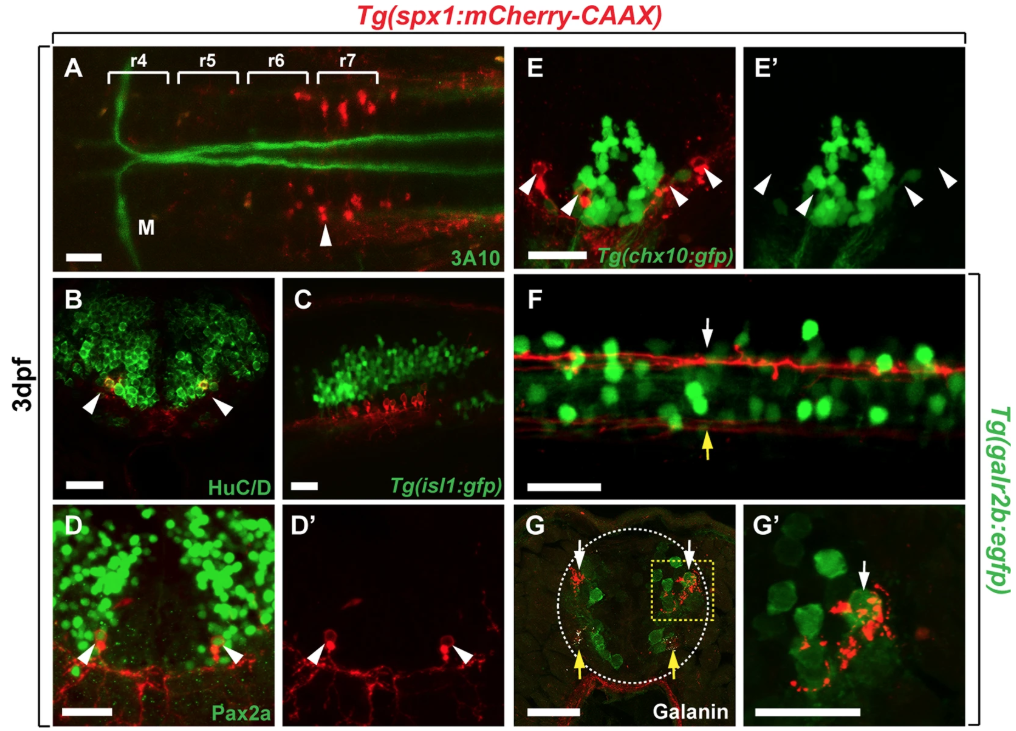
Characterisation of hindbrain SPX1 neurons and their projections. Dorsal (A) and lateral (C,F) views of zebrafish larvae at 3 days post-fertilisation (dpf), anterior to the left. Transverse sections of the hindbrain (B,D,D’,E,E’) and spinal cord (G,G’) at 3 dpf, dorsal to the top. (A,B) Labelling of Tg(spx1:mCherry-CAAX) larvae with anti-3A10 and anti-HuC/D antibodies to detect Mauthner axons (A, green) and post-mitotic neurons (B, green), respectively. (C) Tg(spx1:mCherry-CAAX); Tg(isl1:gfp) larvae to detect hindbrain SPX1 neurons and cranial motor neurons (green). (D,D’) Labelling of Tg(spx1:mCherry-CAAX) larvae with anti-Pax2 antibody (green). mCherry-CAAX fluorescence is detected in the membrane surrounding Pax2a+ neuronal cell bodies. (E,E’) Transverse section of the hindbrain of Tg(spx1:mCherry-CAAX); Tg(chx10:gfp) larvae. Arrowheads indicate spx:mCherry+/chx10:EGFP− neurons. (F) Lateral view of the spinal cord of Tg(spx1:mCherry-CAAX); Tg(galr2b:egfp) larvae. Arrows indicate spinal projections of hindbrain SPX1 neurons. (G,G’) Transverse sections of the spinal cord of Tg(spx1:mCherry-CAAX); Tg(galr2b:egfp) larvae. White arrows indicate the axonal projections of hindbrain SPX1 neurons, which interact with galr2b-expressing neurons in the dorsal spinal cord. Yellow arrows indicate the axonal projections of hindbrain SPX1 neurons in the ventral spinal cord. Abbreviation: M, Mauthner neuron; r, rhombomere. Scale bar: 25 μm