
Fig. 4
- ID
- ZDB-IMAGE-190708-10
- Publication
- Morales et al., 2019 - Peripheral Macrophages Promote Tissue Regeneration in Zebrafish by Fine-Tuning the Inflammatory Response
- All Figures
- Figures for Morales et al., 2019
|
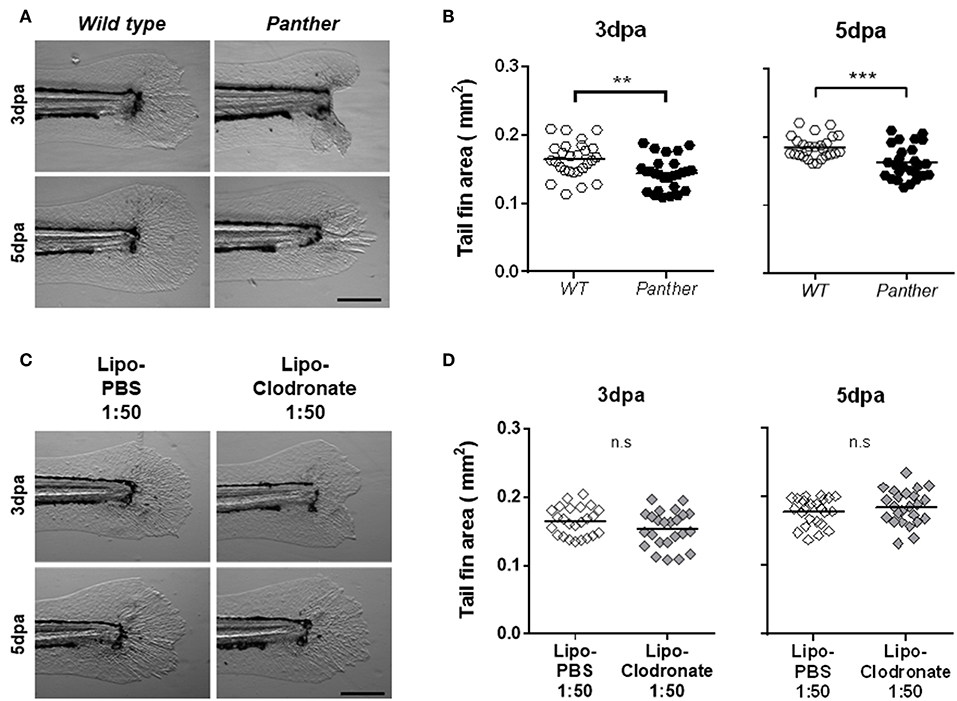
Fig. 4
Panther individuals exhibit an impaired tail fin regeneration. The tail fin area of regenerating tail fins was calculated at 3 and 5 dpa. (A) Representative regenerating tail fins in panther and WT larvae. Scale bar = 200 μm. (B) Tail fin area quantification of regenerating tail fins in panther and WT larvae at both timepoints. A total of 27 larvae per group was used for the analysis. (C) Regenerating tail fin images of Lipo-clodronate 1:50 and Lipo-PBS 1:50 treated larvae. (D) Quantification of the tail fin area in Lipo-clodronate 1:50 and Lipo-PBS 1:50 treated individuals. A total of 24 larvae per group was used for the analysis. n.s not significant; **p < 0.01; ***p < 0.001.