
Image
|
Figure Caption
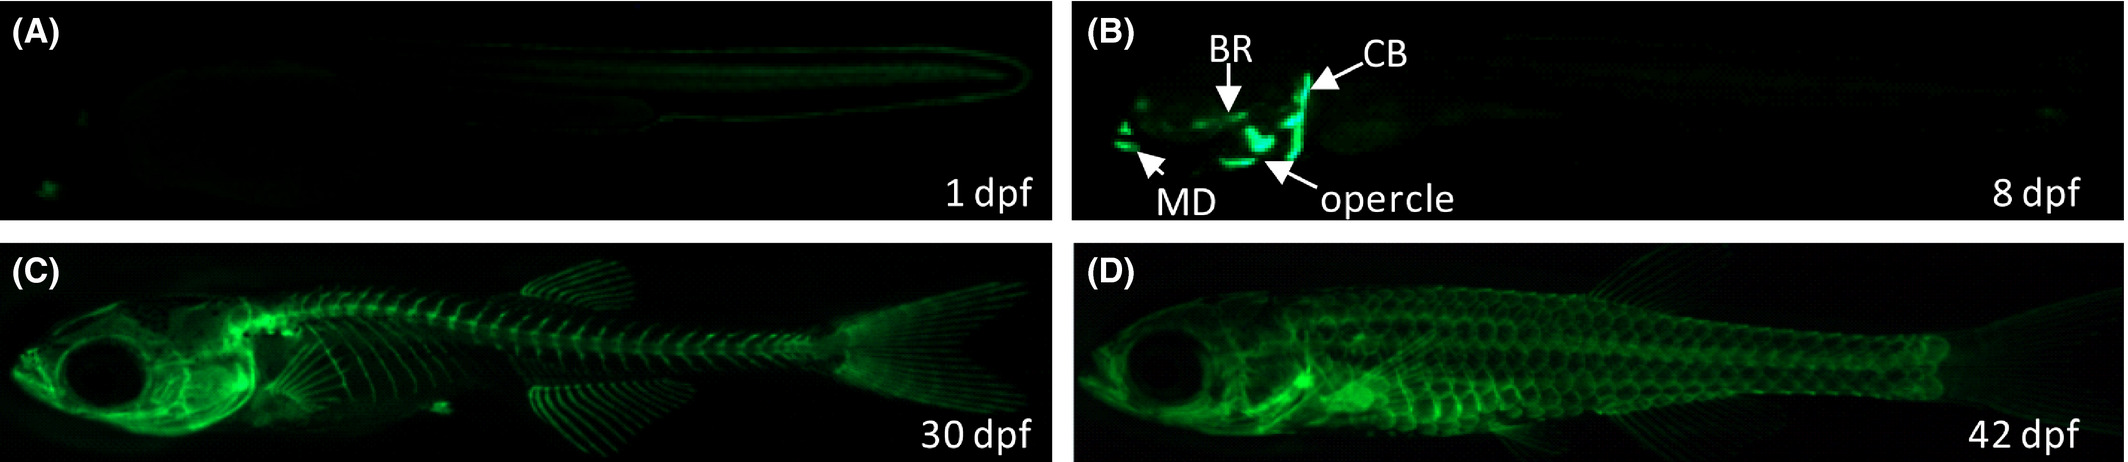
Fig. 1
eGFP expression patterns in Tg(ola.sp7:nlsGFP) zebrafish. (A), At 1 d postfertilization (dpf), GFP is weakly expressed in the posterior trunk and tail regions. (B), Until 8 dpf, GFP‐labeled osteoblasts are detectable in ceratobranchial, opercle, branchiostegal rays, and mandible of the head region. (C), The rostral skeleton, axial skeleton, fin, and tail vertebral columns are clearly labeled by eGFP in 30 dpf juvenile fish. (D), Fluorescent fish scales are visible in 42 dpf transgenic fish. CT, cleithrum; BR, branchiostegal rays; MD, mandible
Figure Data
Acknowledgments
This image is the copyrighted work of the attributed author or publisher, and
ZFIN has permission only to display this image to its users.
Additional permissions should be obtained from the applicable author or publisher of the image.
Full text @ Animal Model Exp Med