
|
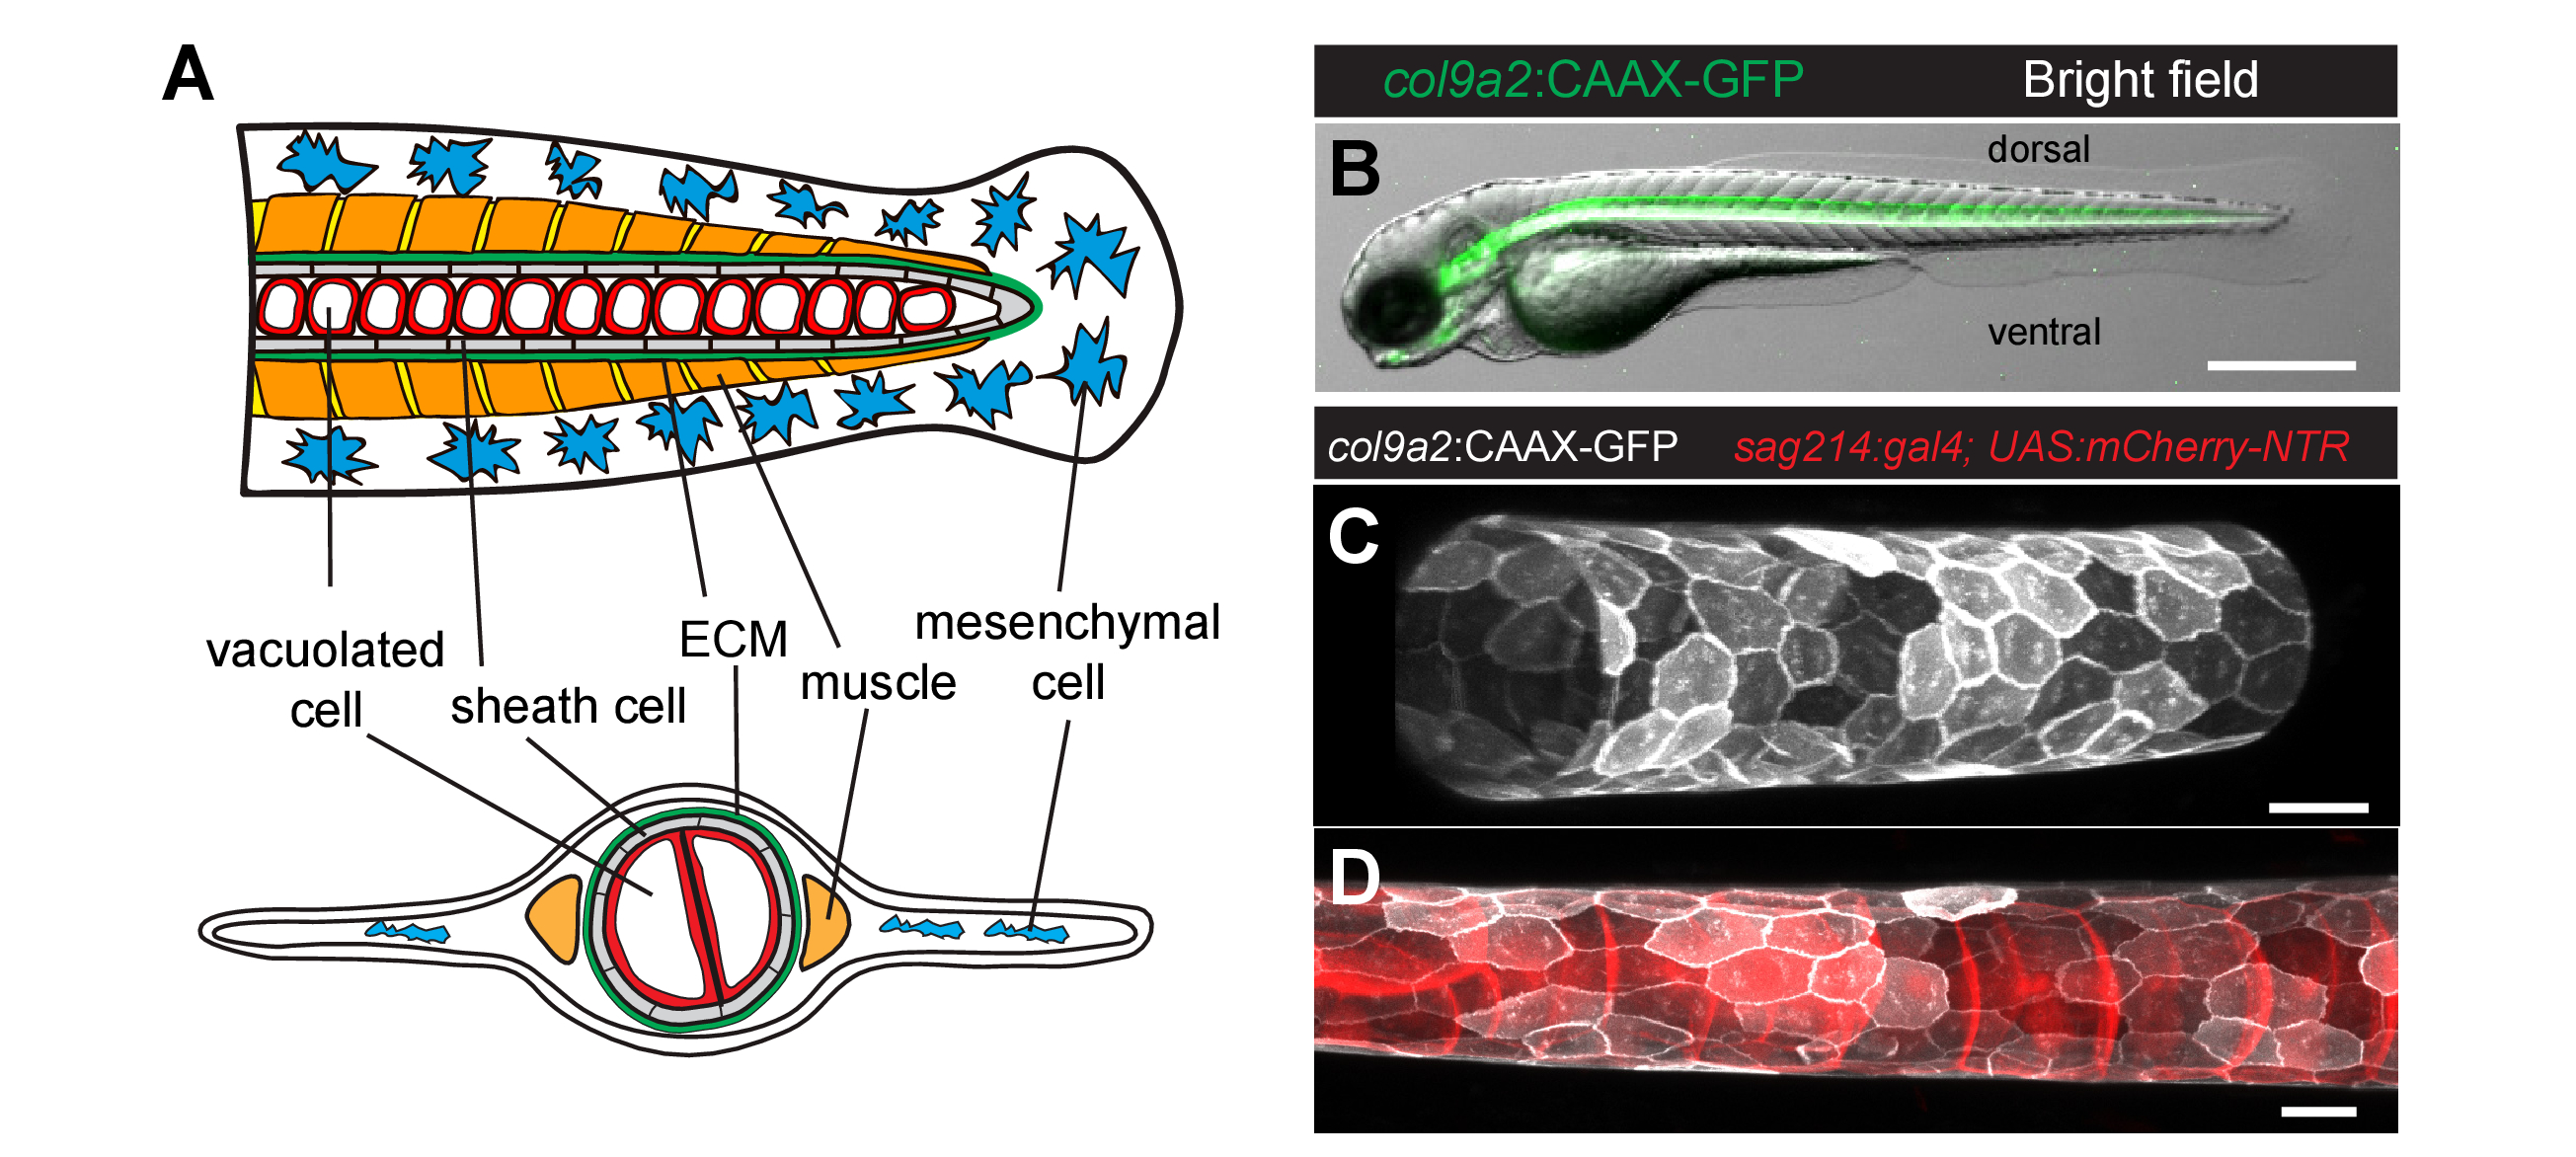
Fig. 1
Characterization of the zebrafish notochord at 3 days post fertilization (dpf). (A) Schematic of the zebrafish tail at 3 dpf. Lateral (top) and transverse (bottom) views. (B) Bright field with overlapping fluorescence of a Tg(col9a2:GFPCaaX) zebrafish embryo at 3 dpf with GFP fluorescence from sheath cells. (C-D) Maximum intensity projection of the notochord in triple transgenic Tg(col9a2:GFPCaaX); SAGFF214A; Tg(UAS-E1b:NfsB-mCherry) zebrafish embryo at 3 dpf. Sheath cells (C) or simultaneously sheath and vacuolated cells (D) can be observed. Scale bars, 500 μm in (B), 20 μm in (C and D). ECM, extracellular matrix.