
Image
|
Figure Caption
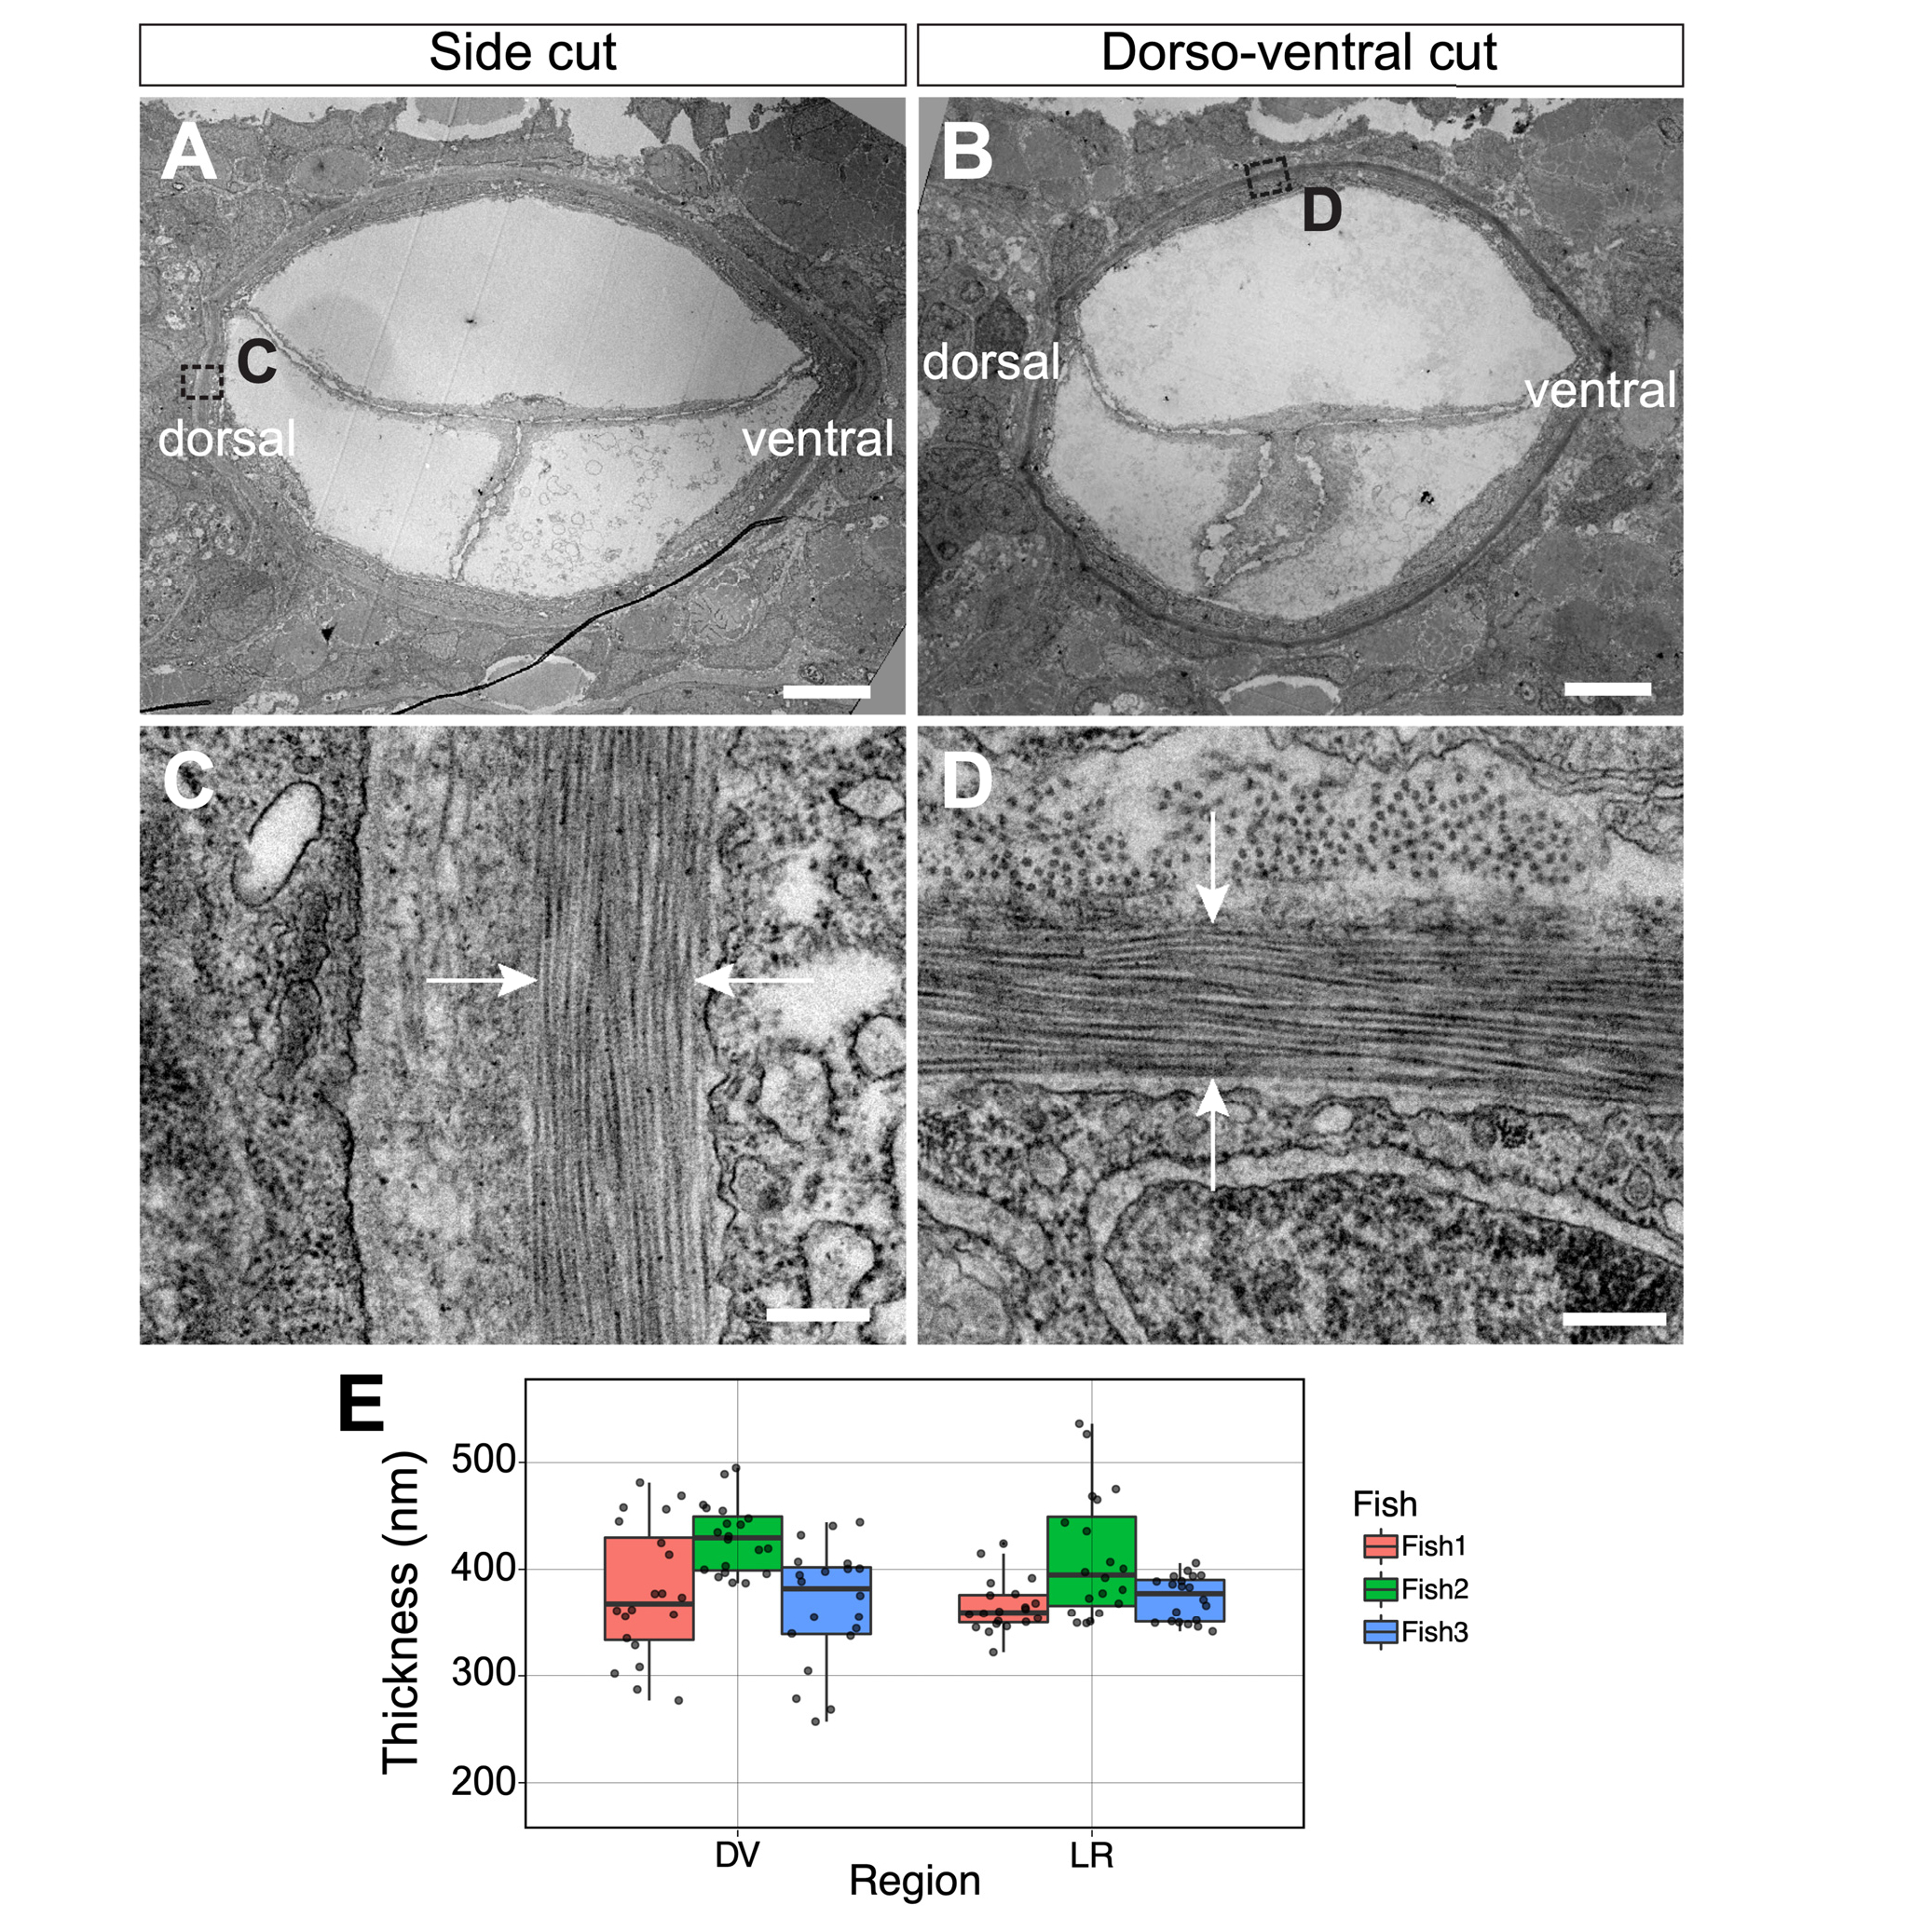
Fig. 3
(A-B) Low magnification TEM of transverse notochord after side (A) and dorso-ventral (B) cuts of a Tg(col9a2:GFPCaaX) zebrafish embryo at 3 dpf and ~200-250 µm anterior from the posterior end of the notochord. (C-D) High magnification TEM of transverse view ECM (between white arrows) after side (C) and dorso-ventral (D) cuts. (E) Quantification of ECM thickness in left-right (LR) and dorso-ventral (DV) regions of 3 embryos. Scale bars, 5 μm in (A and B) and 250 nm in (C and D).
Acknowledgments
This image is the copyrighted work of the attributed author or publisher, and
ZFIN has permission only to display this image to its users.
Additional permissions should be obtained from the applicable author or publisher of the image.
Full text @ Biomed. Opt. Express