
|
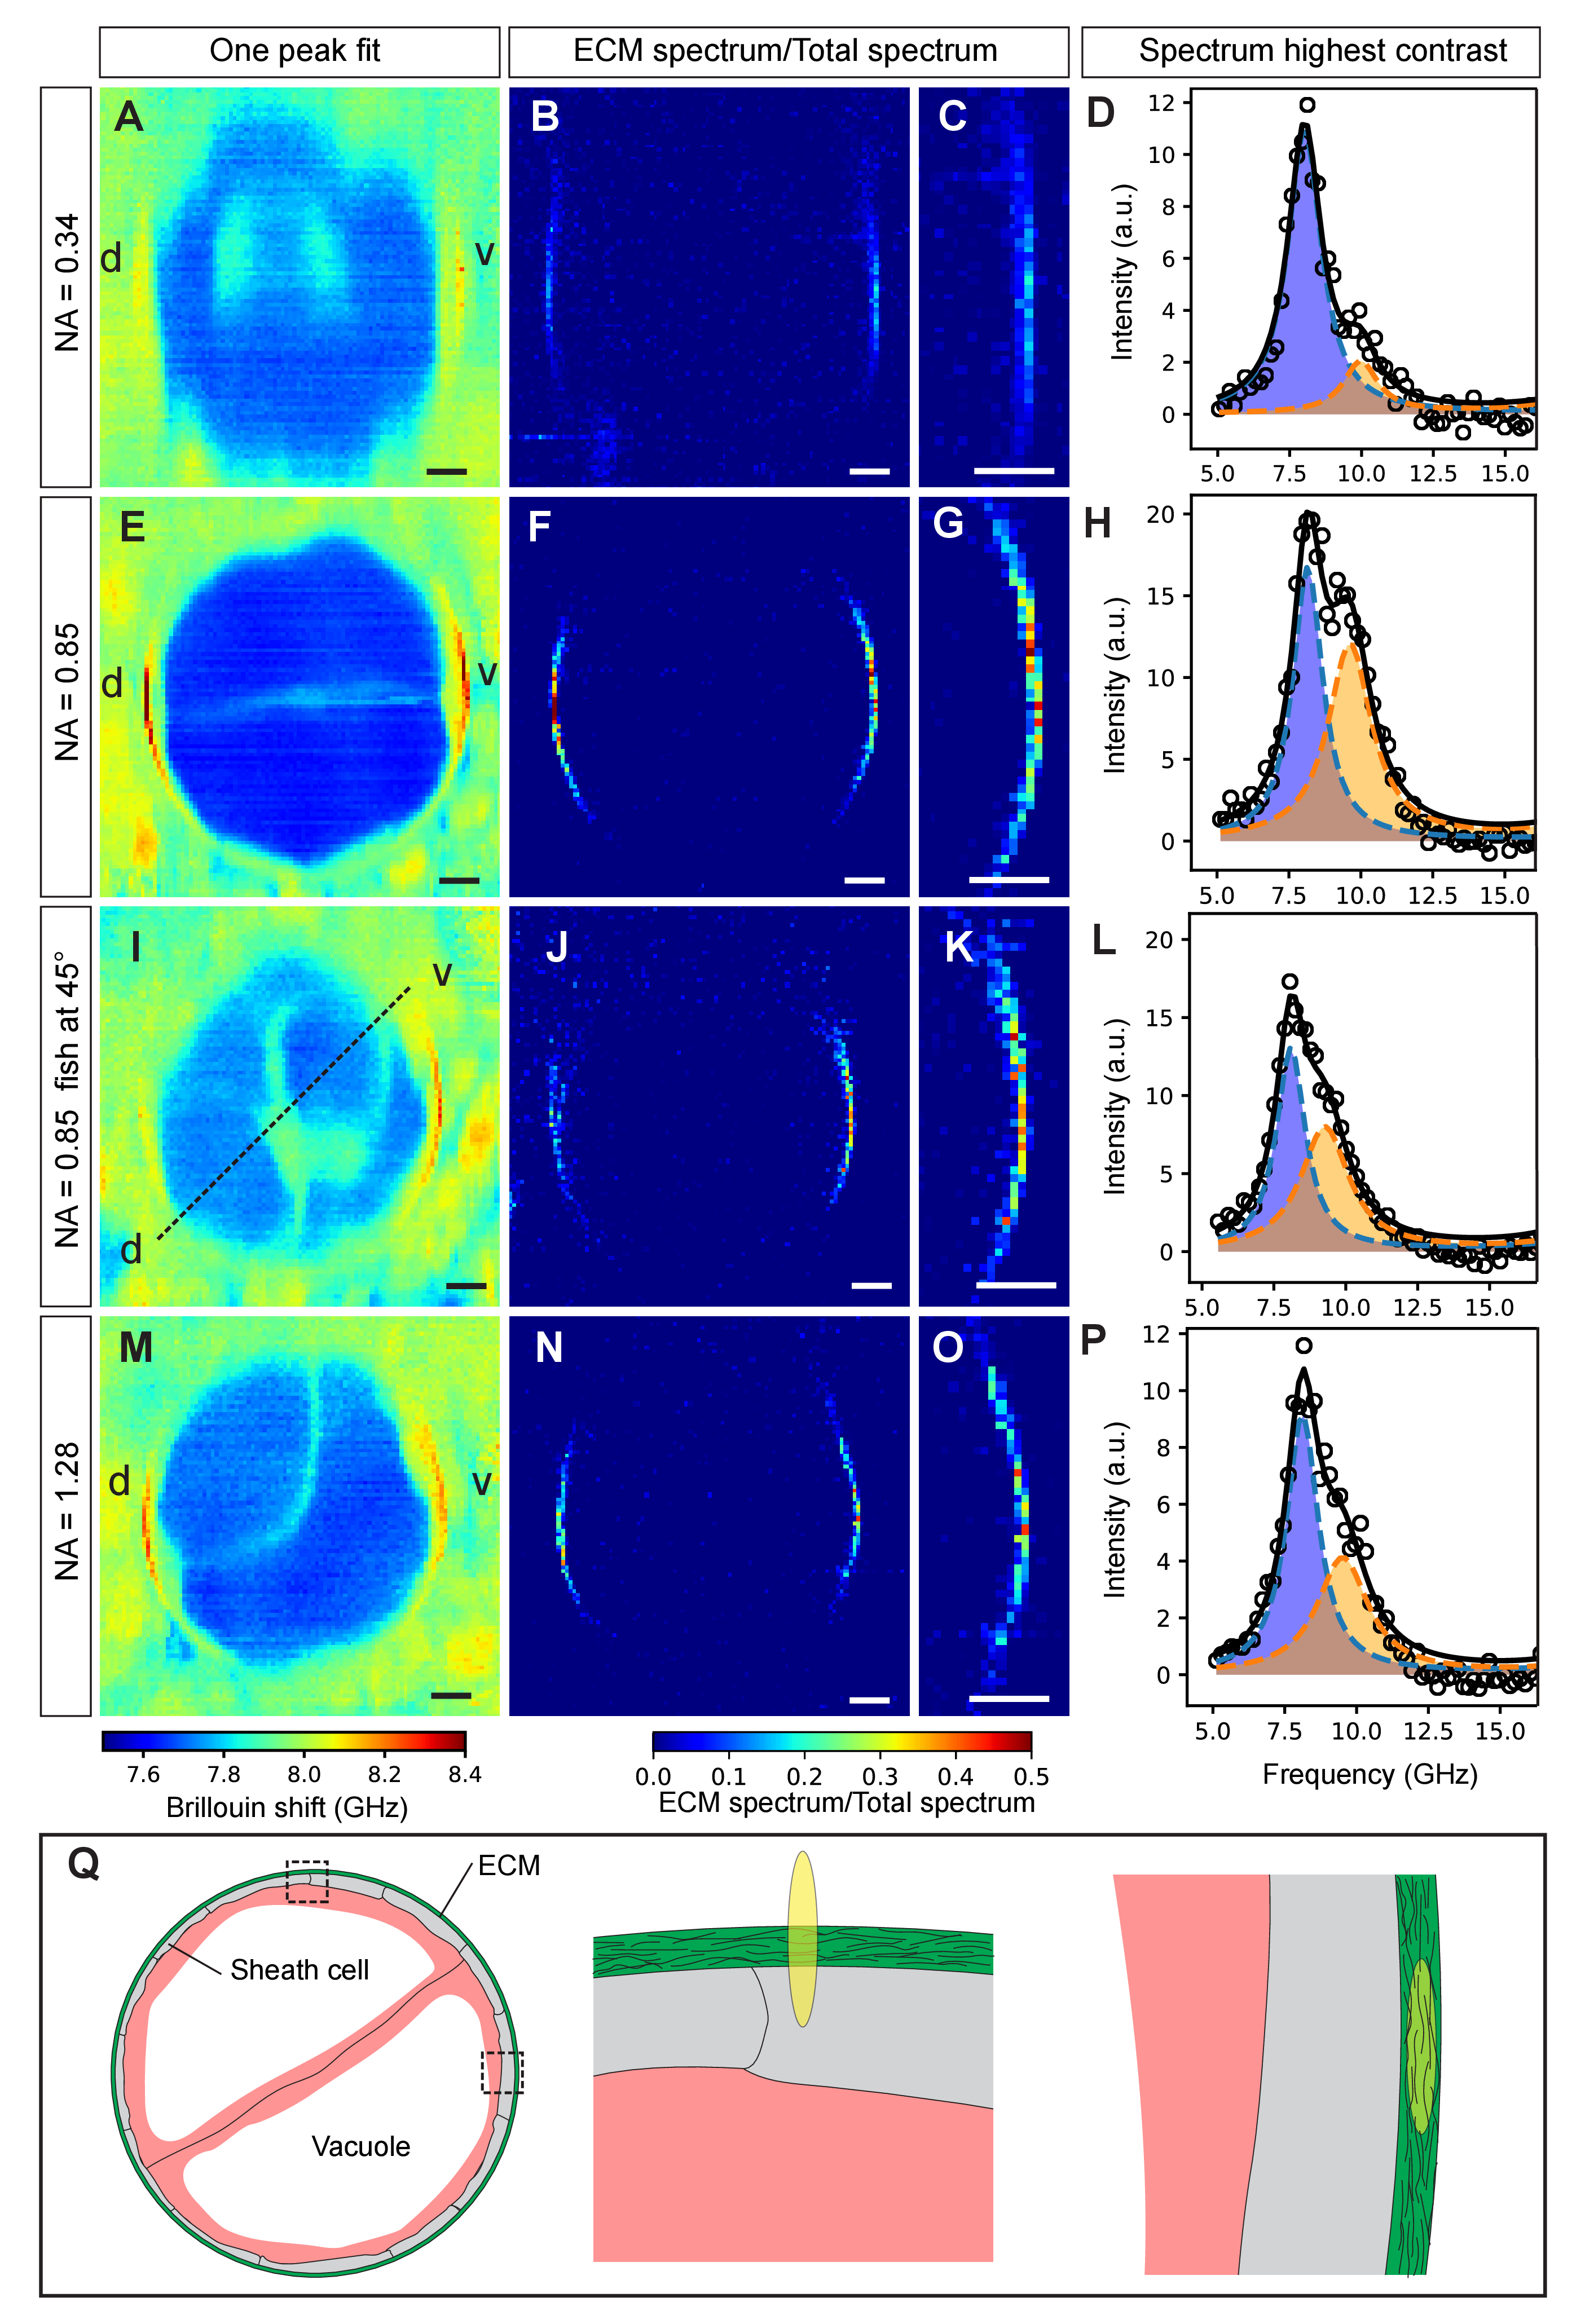
Fig. 5
Axial cross-section of zebrafish notochord mechanics. The effect of objective NA on the Brillouin map and contrast of the ECM is shown for low (0.34), medium (0.85), medium (0.85) of 45-degree rotated sample and high (1.28) effective NA in A-D, E-H, I-L and M-P respectively. In traditional single-peak fit Brillouin shift maps the ECM displays poor visibility (A,E,I,M). Dual-peak analysis and plotting the spectral ratios does improve contrast (B,F,J,N). (C,G,K,O) Zoom-ins. (D,H,L,P) Spectra of pixels with the highest contrast in (C,G,K,O), respectively. (Q) Illustration showing the cross-section of the notochord (left) as well as the overlap of the PSF with the ECM when measuring on the lateral (middle) and dorso-ventral (right) side, respectively. Brillouin images were obtained using 8.3 mW of laser power and 0.25 s of exposure time per pixel. Step size: 0.5 µm. d, dorsal; v, ventral. Scale bars, 10 µm.