
|
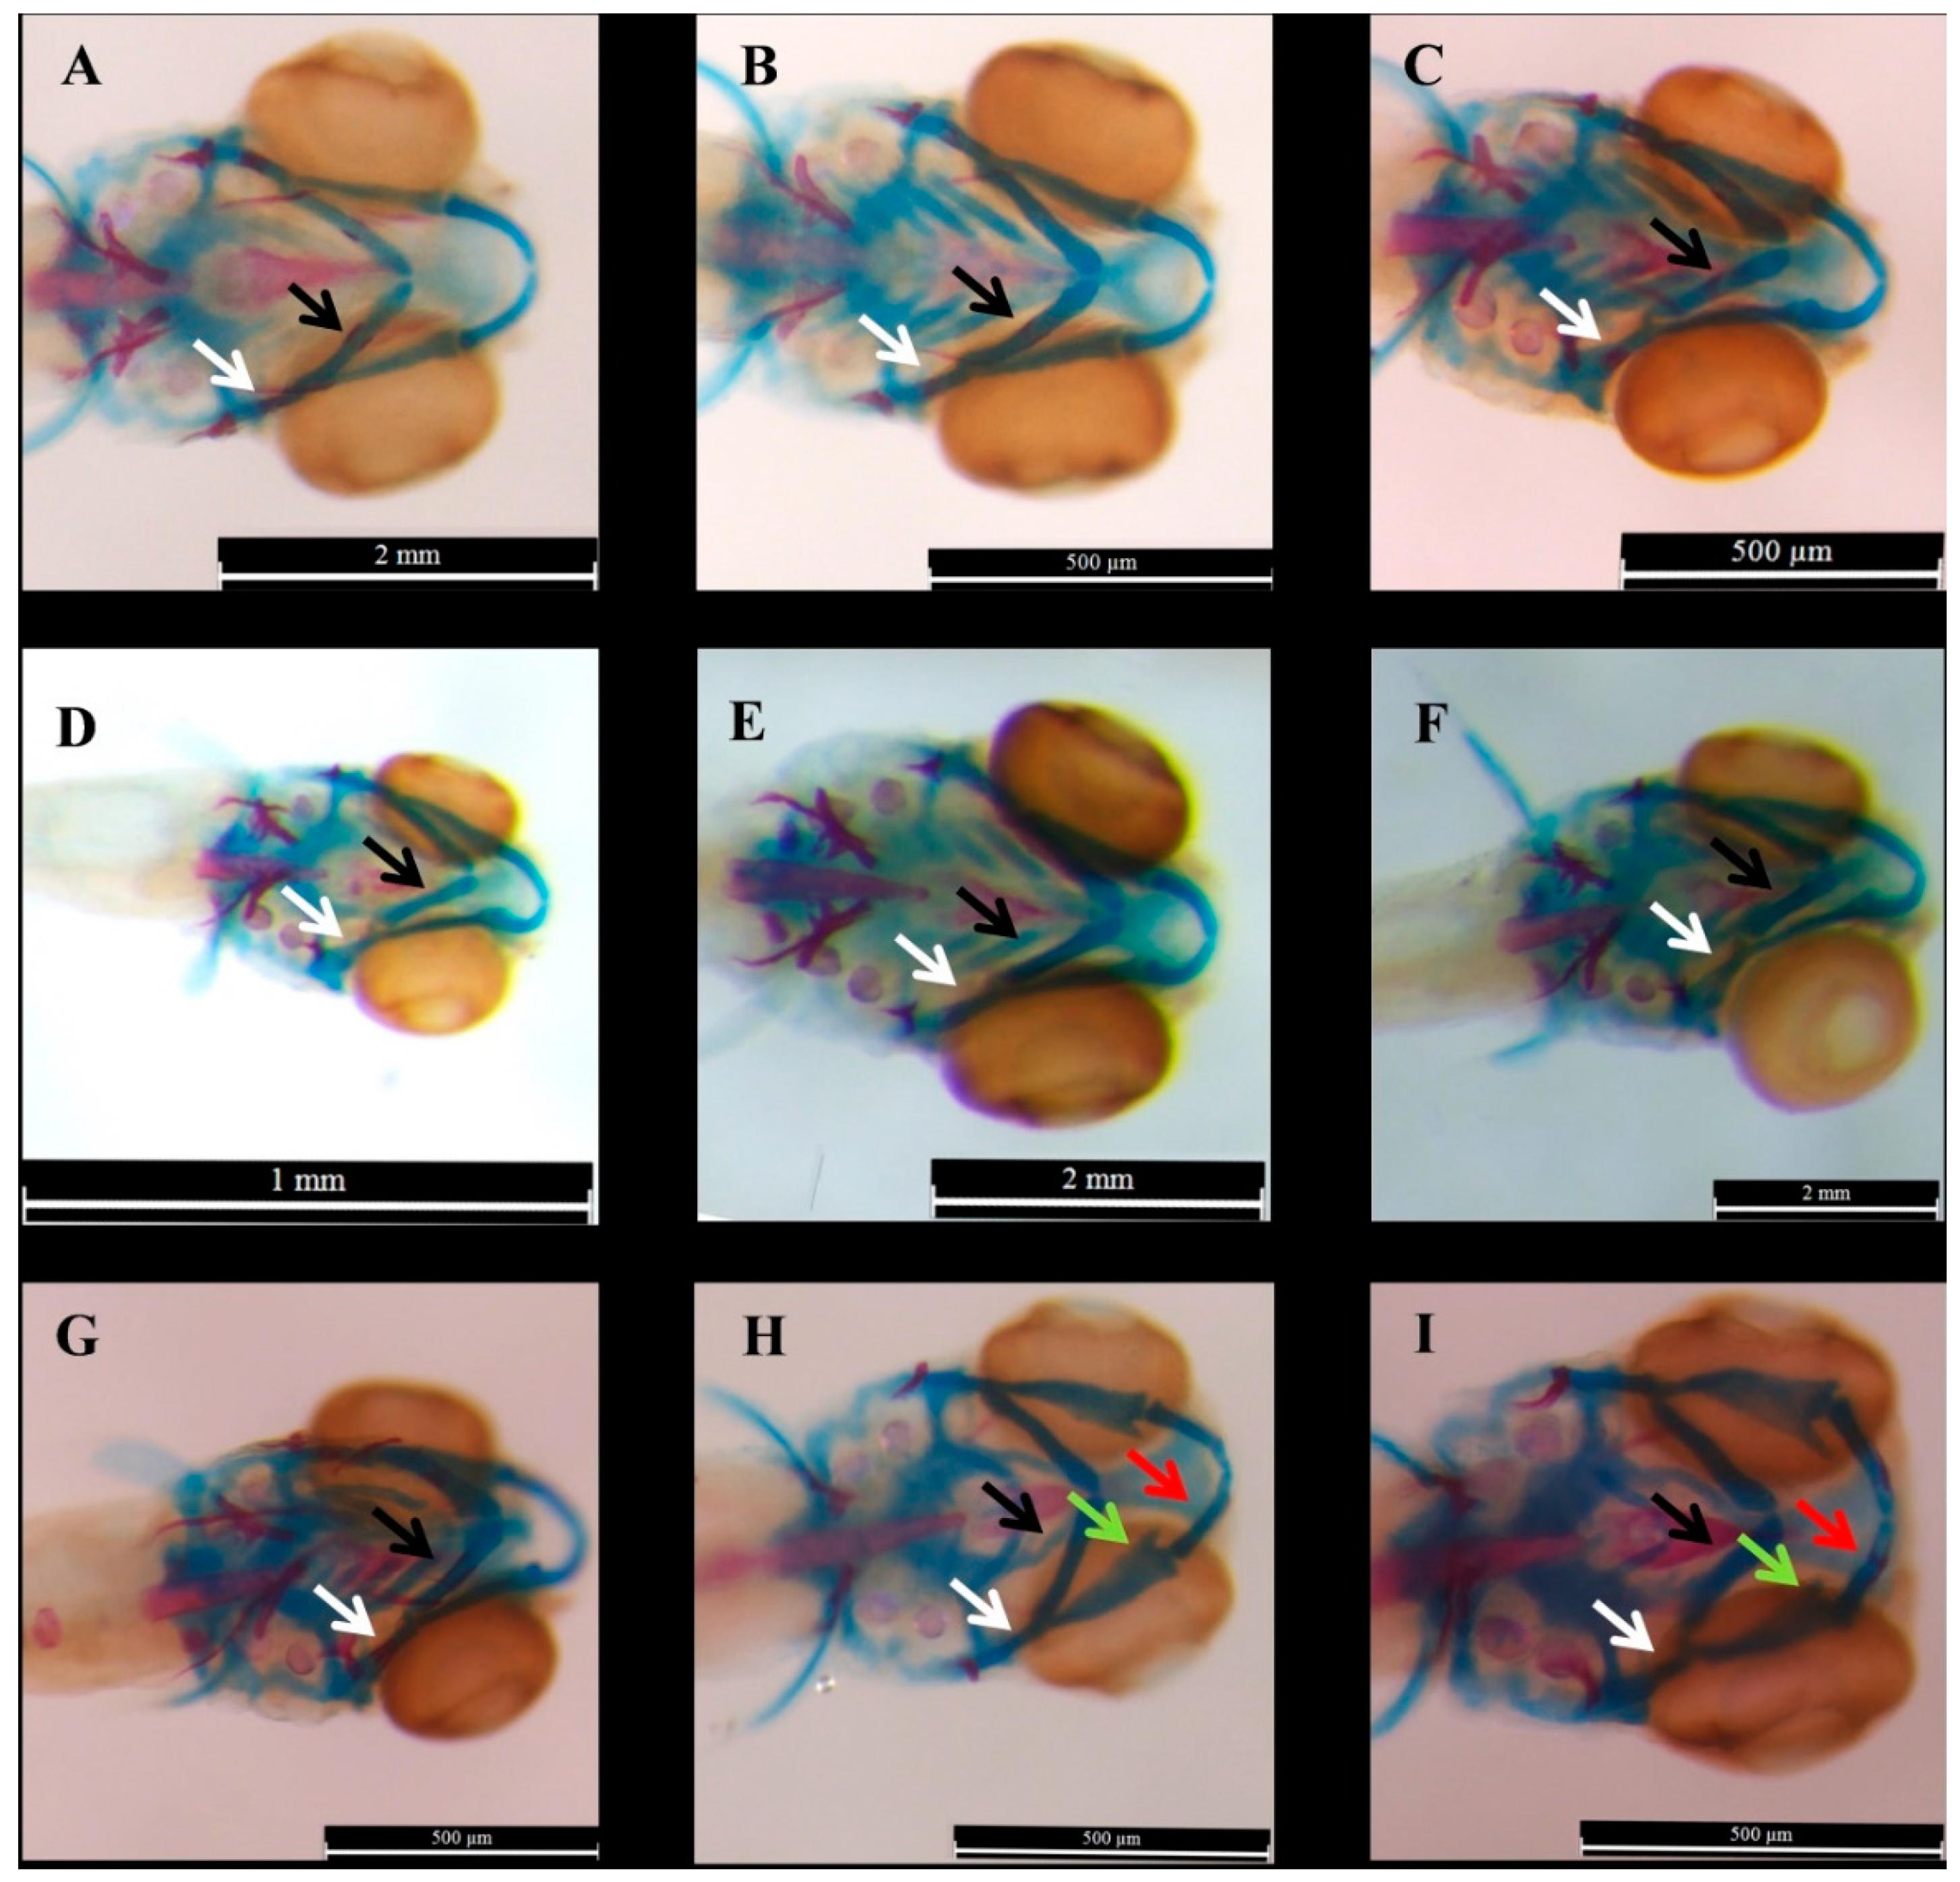
Fig. 1
The samples of the morphological changes in the E2-treated zabrafish at 6 dpf which were treated with 2, 10 and 20 µM of E2 compared to DMSO (0.1%) at 1 dpf, 2 dpf, or 3 dpf. Scale bars represent 500 µM, 1 mm, and 2 mm. The blue parts represent ceratohyal and red parts demonstrate mineralized sections. (A–C) indicate the samples of the larvae which were treated with 2 µM of E2 at 1 dpf, 2 dpf, and 3 dpf, respectively, (D–F) Show the result of alcian blue-alizarin red staining larvae which were exposed to DMSO (0.1%) at 1 dpf, 2 dpf, and 3 dpf, respectively. (G–I) represent the larvae which were exposed to E2 at 3 dpf with 10, 20, and 20 µM. The arrows demonstrate some changes: white for hyomandibular, black for ceratohyal, green for palatoquadrate, and red arrows for Meckel.