
Fig. 5
- ID
- ZDB-IMAGE-190703-4
- Genes
- Publication
- Pandey et al., 2019 - A Smart Imaging Workflow for Organ-Specific Screening in a Cystic Kidney Zebrafish Disease Model
- All Figures
- Figures for Pandey et al., 2019
|
Fig. 5
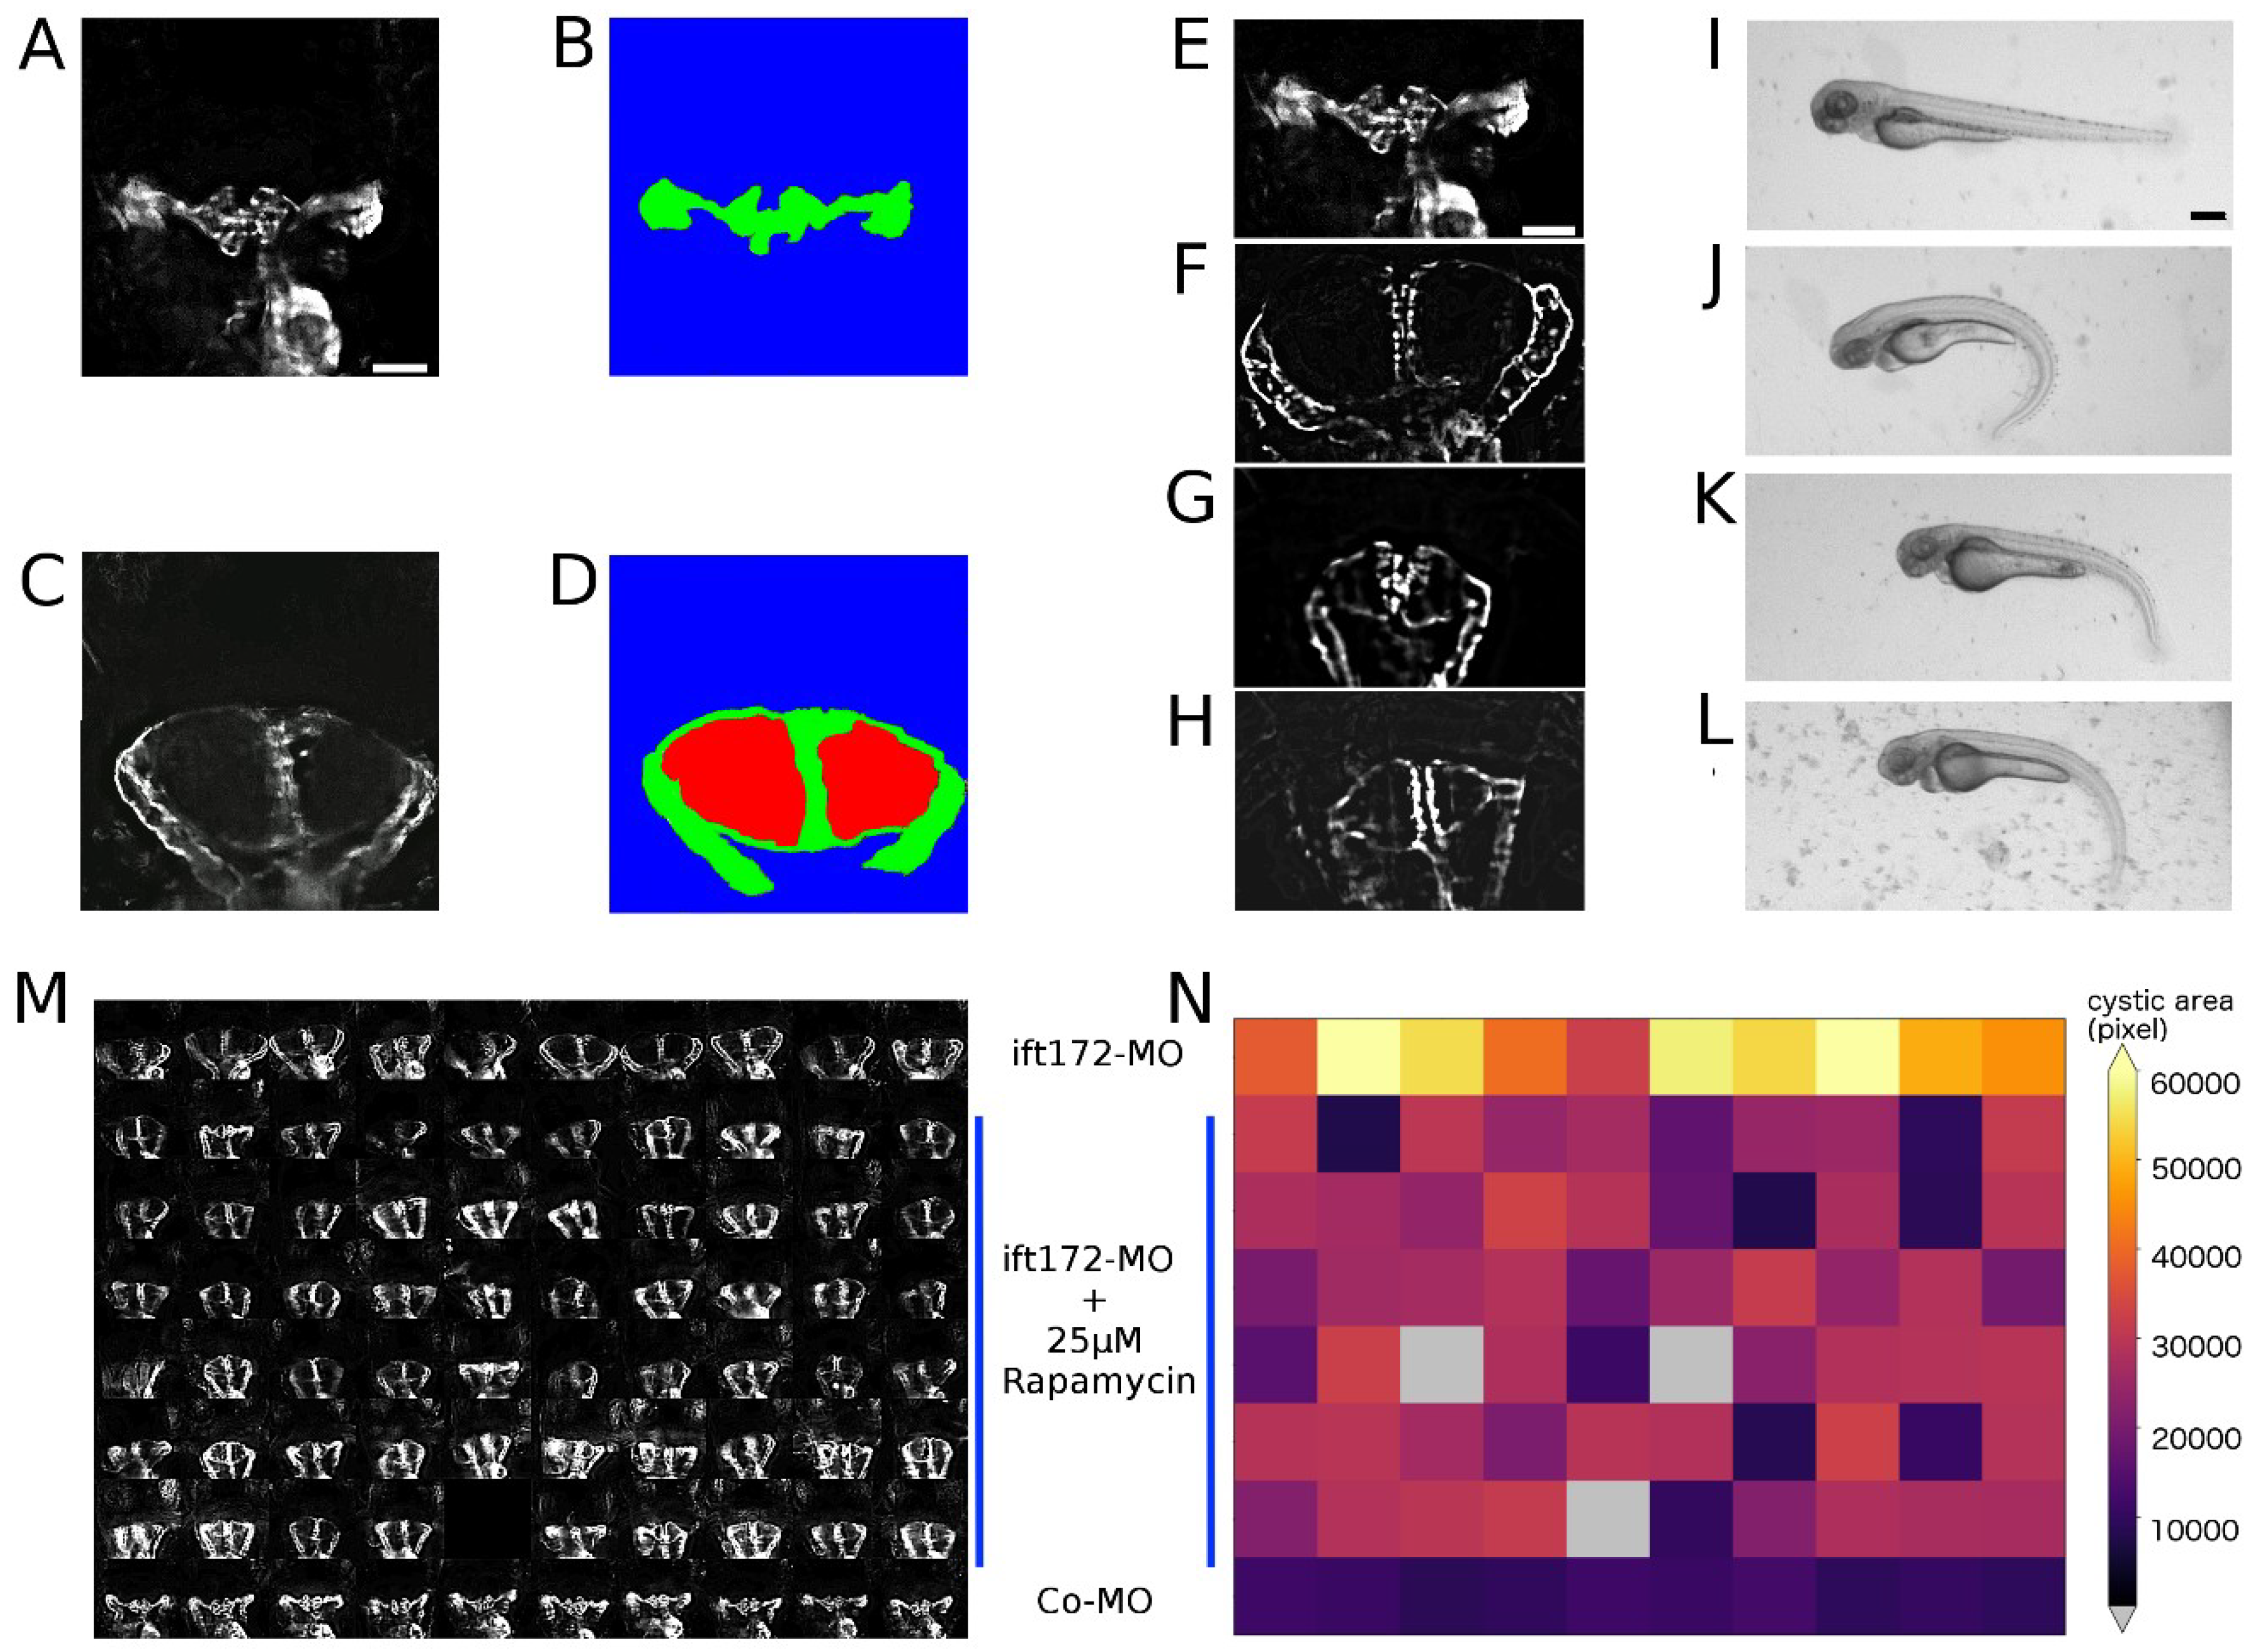
Automated scoring of pronephric phenotypes. (A–D) Quantification of pronephric tissue and cystic area in the controls (A,B) and cystic kidneys (C,D) acquired with 10x objective. Green depicts GFP-positive pronephric tissue, and red depicts cystic area. Scale bar for A–D is 50 µm. (E,F) Fluorescence and stereo microscope images of dose–response experiments administering rapamycin Co-MO or ift172-MO-injected embryos at 72 hpf. (E,I) The control, (F,J) ift172-MO injected, (G,K) ift172-MO + 25 µM rapamycin-exposed and (H,L) ift172-MO + 50 µM rapamycin-exposed larvae are shown. Scale bar for E–H is 50 µm and for I–L is 250 µm. (M) Montage representing 72 hpf pronephros in a microtiter plate; the first row is ift172-MO injected, last row is wild type and rest of the rows are 25 µM rapamycin-exposed larvae. (N) The corresponding heatmap displays rapamycin-based suppression of kidneys in reference to the cystic (first row) and wild-type (last row) controls.