
IMAGE
Fig. 1
- ID
- ZDB-IMAGE-190703-19
- Publication
- Kuil et al., 2019 - Reverse genetic screen reveals that Il34 facilitates yolk sac macrophage distribution and seeding of the brain
- All Figures
- Figures for Kuil et al., 2019
Image
|
Figure Caption
Fig. 1
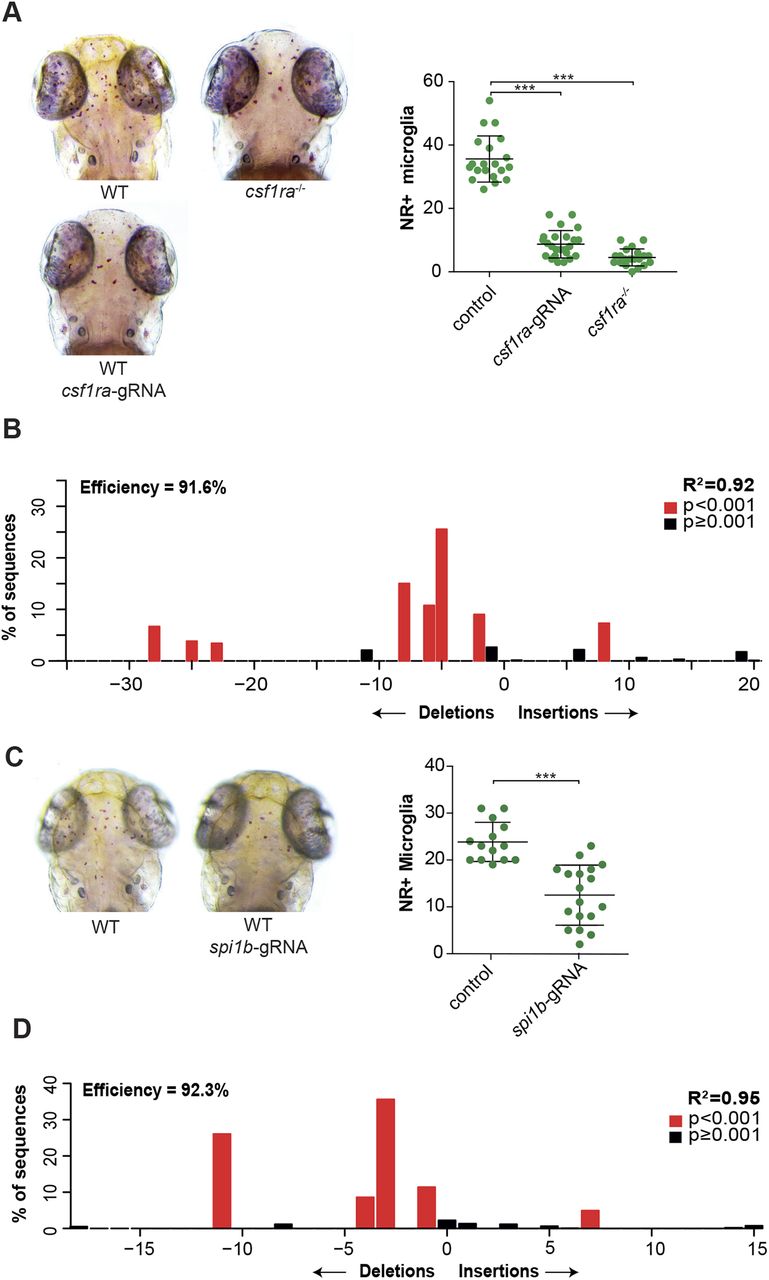
csf1r CRISPants phenocopy existing csf1r microglia mutants. (A) Neutral Red (NR+) images and quantification of wild-type (WT), csf1ra−/− and csf1ra CRISPant zebrafish larvae at 3 dpf. (B) Indel spectrum of a pool of csf1ra CRISPants calculated by TIDE. (C) NR images and quantification of WT and spi1b CRISPant zebrafish larvae at 3 dpf. (D) Indel spectrum of a representative individual spi1b CRISPant calculated by TIDE. The R2 value represents reliability of the indel spectrum. ***P<0.001. One-way ANOVA and Student's t-test. Each dot represents one larva. Error bars represent s.d.
Figure Data
Acknowledgments
This image is the copyrighted work of the attributed author or publisher, and
ZFIN has permission only to display this image to its users.
Additional permissions should be obtained from the applicable author or publisher of the image.
Full text @ Dis. Model. Mech.