
Fig. 3
- ID
- ZDB-IMAGE-190701-87
- Genes
- Publication
- Goudarzi et al., 2019 - Individual long non-coding RNAs have no overt functions in zebrafish embryogenesis, viability and fertility
- All Figures
- Figures for Goudarzi et al., 2019
|
Fig. 3
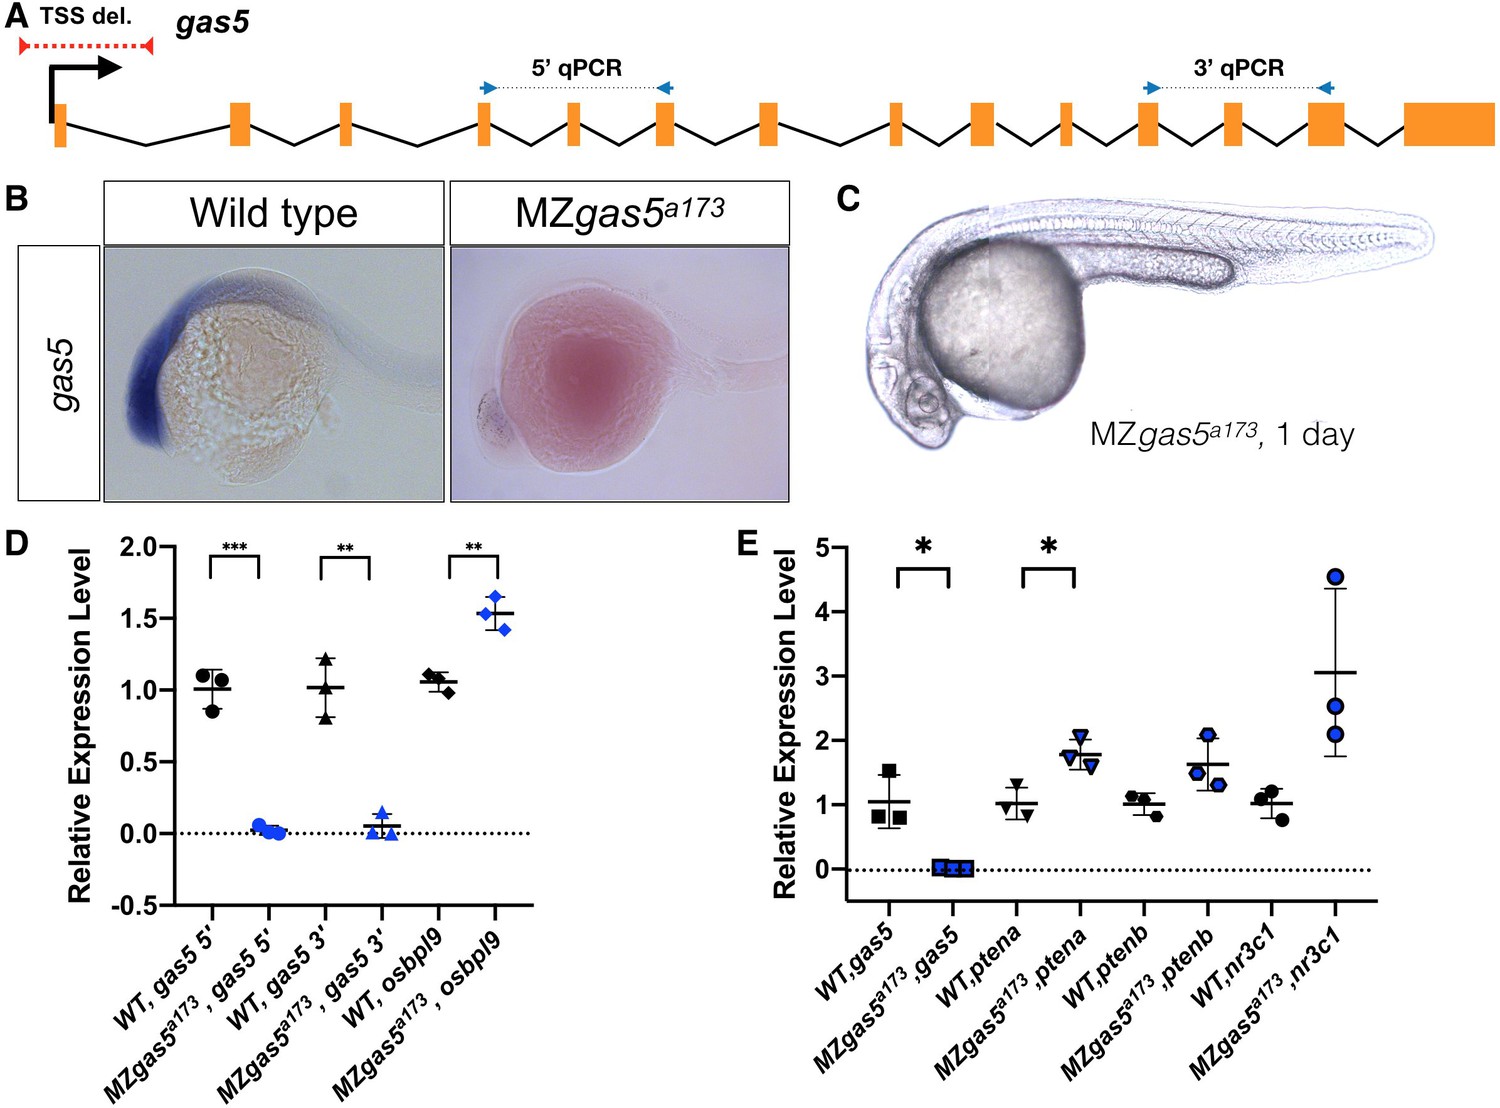
Normal embryogenesis of gas5 mutants.
(A) Position of the TSS-deletion allele in gas5 is marked by dashed red line. Arrows flanking black dotted lines mark the primer binding sites for 5’-qPCR and 3’-qPCR products. (B) Representative in situ hybridization images for gas5 in wild type (11/11) and homozygous TSS-deletion mutants (11/11). (C) Maternal and Zygotic gas5 (MZgas5) mutant embryos at 1-dpf were indistinguishable from the wild-type embryos at the same developmental stage (not shown). (D) Expression level of gas5 and osbpl9 measured by qRT-PCR. Tor3A, the other neighboring gene, was not expressed at the investigated time-point. (E) Expression level of gas5, its trans targets ptena, ptenb and nr3c1measured by qRT-PCR. The statistical significance of the observed changes was determined using t-test analysis and represented by star marks (*, **, ***, and **** respectively mark p-values<0.05,<0.01,<0.001 and<0.0001).