
Fig. 2
- ID
- ZDB-IMAGE-190701-77
- Antibodies
- Publication
- Patowary et al., 2019 - Family-based exome sequencing and case-control analysis implicate CEP41 as an ASD gene
- All Figures
- Figures for Patowary et al., 2019
|
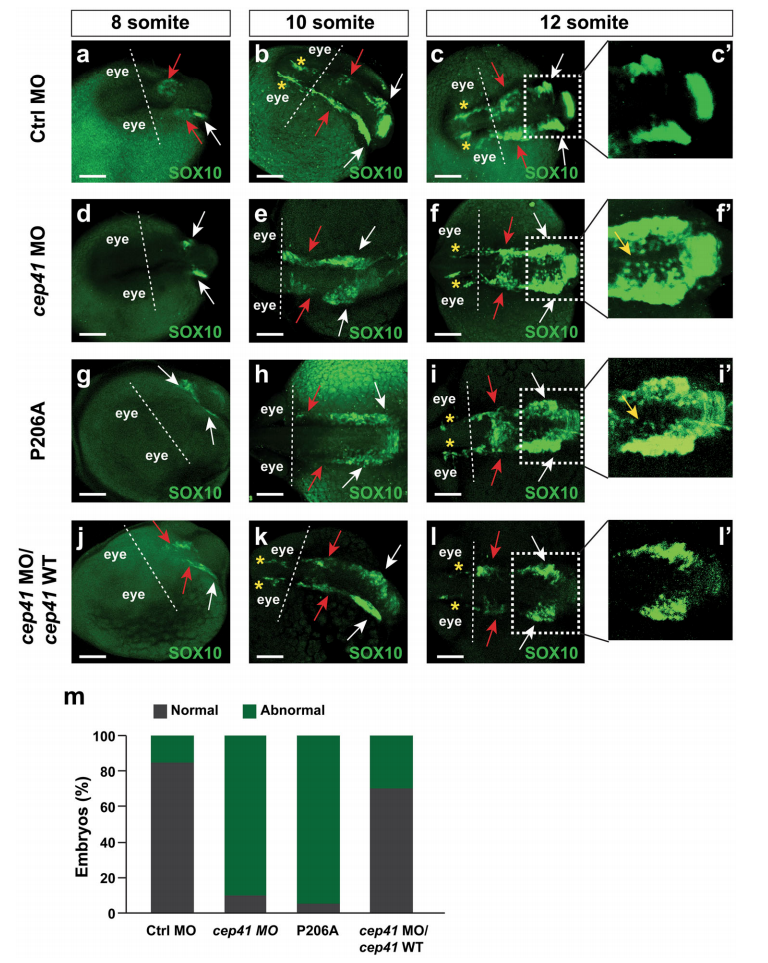
Fig. 2
Analysis of migration of CNC cells in the control MO (a–c), cep41 MO (d–f), P206A (g–i) and cep41 MO+ zebrafish cep41 mRNA (j–l)-injected zebrafish at 8, 10 and 12 somite stages. Asterisks, red arrows and white arrows indicate migrating CNC cells in the forebrain, midbrain and hindbrain, respectively. The extent of medial expansion of CNC cells (yellow arrows, zoomed in area) was compared in the hindbrain of each zebrafish (c′, f′, i′, l′). m. All data are representative of at least five independent experiments. The quantified data of zebrafish with defective CNC cell migration are graphically presented (20 embryos/counting). Abnormal: either delayed migration or medial expansion of CNC cells