
|
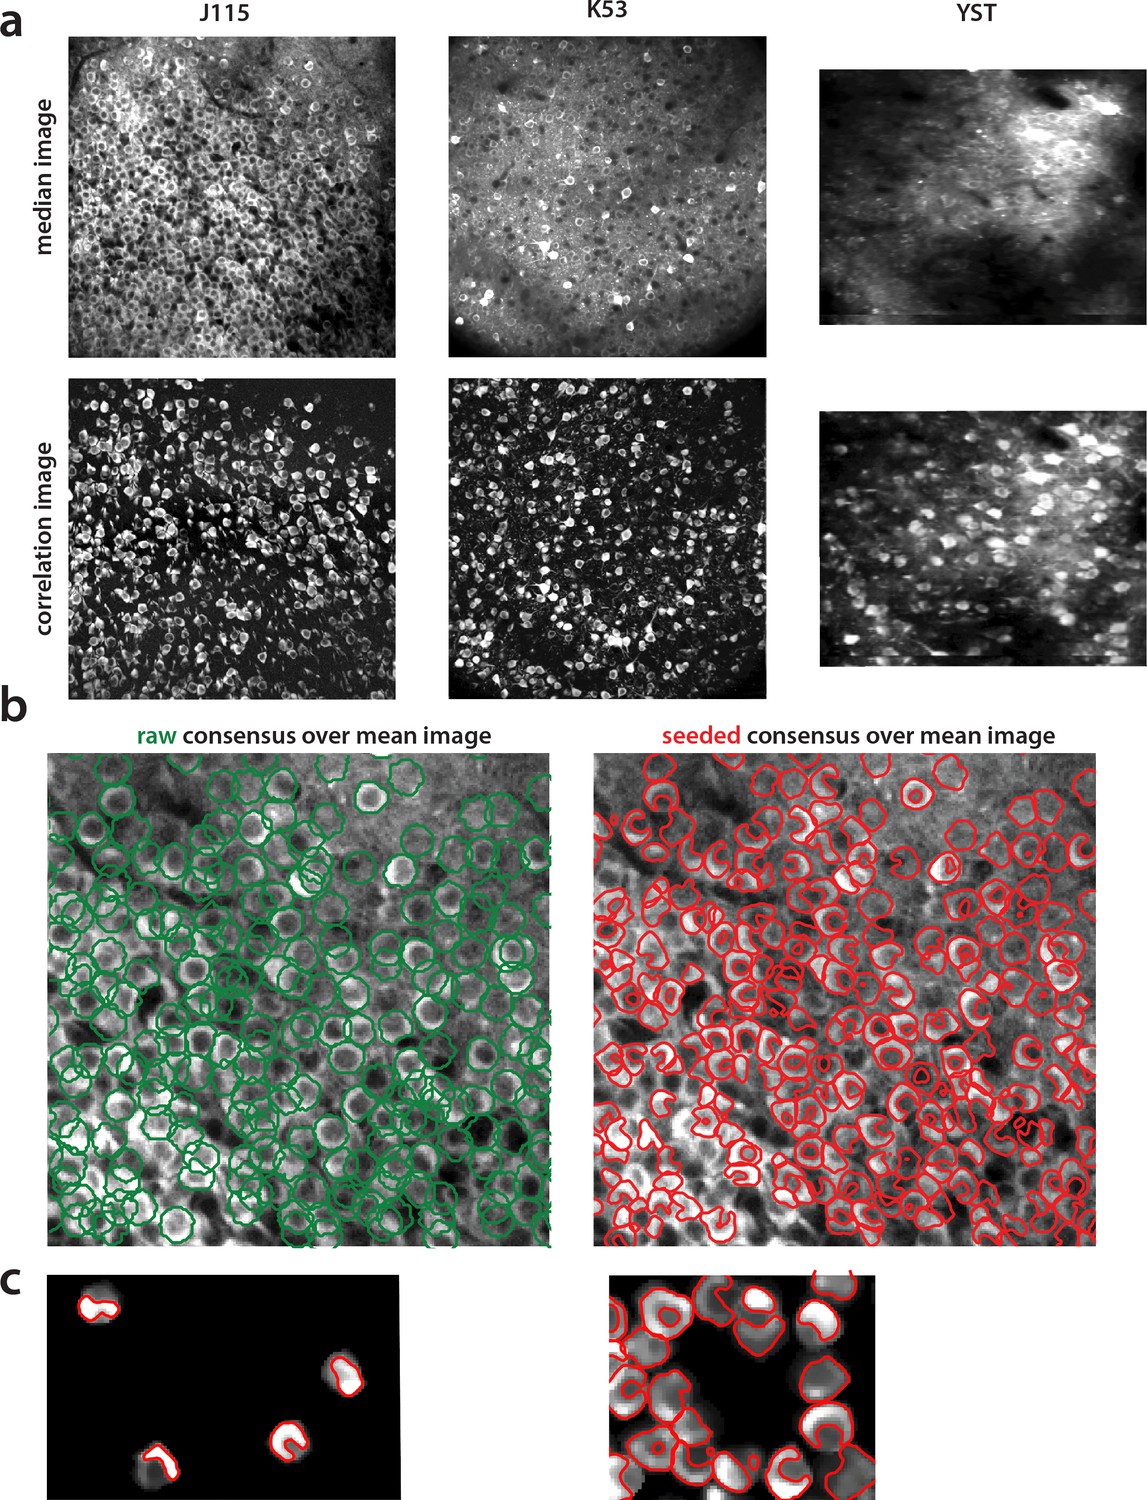
Fig. S1
Construction of components obtained from consensus annotation.
(a) Correlation image can efficiently display active neurons. Comparison of median across time (top) and max-correlation (bottom) image for annotated datasets J115 (left), K53 (middle) and YST (right). In all cases, the correlation image aids in manual annotation by providing an efficient way to remove neuropil contamination and visualize the footprints of active neurons. (b) Contour plots of manual annotations (left) vs spatial footprints obtained after running SeededInitialization (right), for dataset J115 overlaid against the mean image. Manual annotations are restricted to be of ellipsoid shape whereas pre-processing with SeededInitialization allows the spatial footprints to adapt to the footprint of each neuron in the FOV. (c) Thresholding of spatial footprints selects the most prominent part of each neuron for comparison against ground truth. Left. Four examples of non thresholded components overlaid to their corresponding contours. Right. Same as left, but including all neurons within a small region. Finding an optimal threshold to generate consistent binary masks can be challenging.