
Image
|
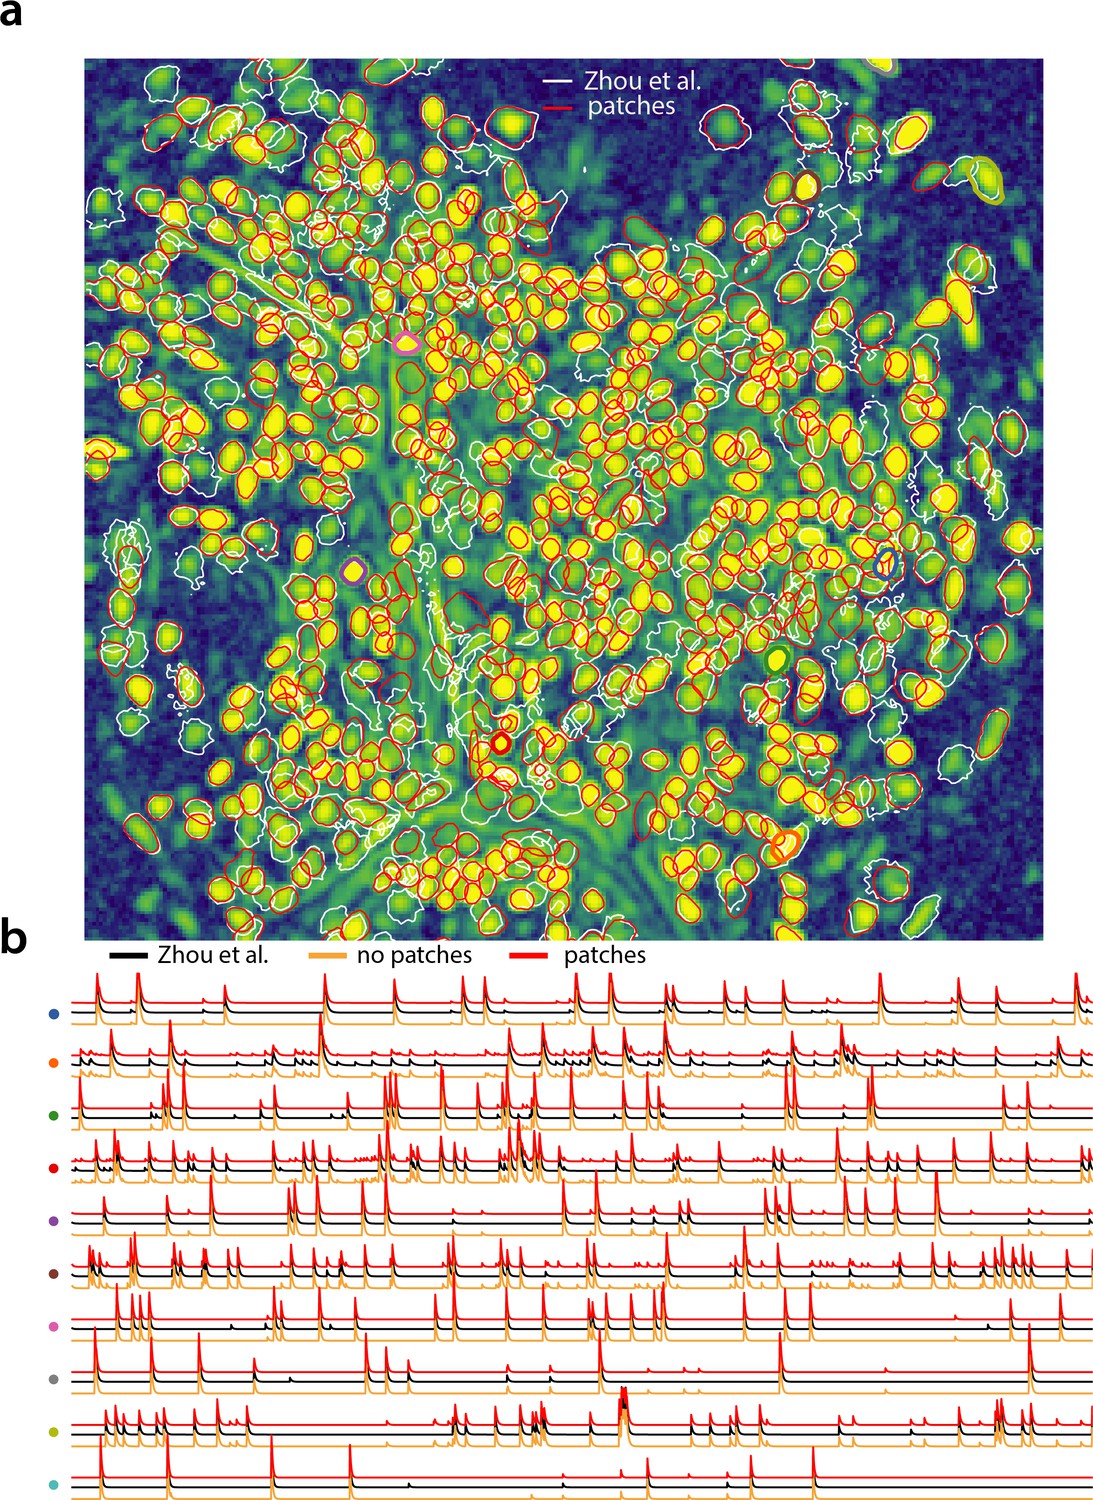
Figure Caption
Fig. 7
Analyzing microendoscopic 1 p data with the CNMF-E algorithm using CaImAnbatch .
(a) Contour plots of all neurons detected by the CNMF-E (white) implementation of Zhou et al. (2018) and CaImAn batch (red) using patches. Colors match the example traces shown in (b), which illustrate the temporal components of 10 example neurons detected by both implementations CaImAn batch . reproduces with reasonable fidelity the results of Zhou et al. (2018).
Acknowledgments
This image is the copyrighted work of the attributed author or publisher, and
ZFIN has permission only to display this image to its users.
Additional permissions should be obtained from the applicable author or publisher of the image.
Full text @ Elife