
|
Fig. 6
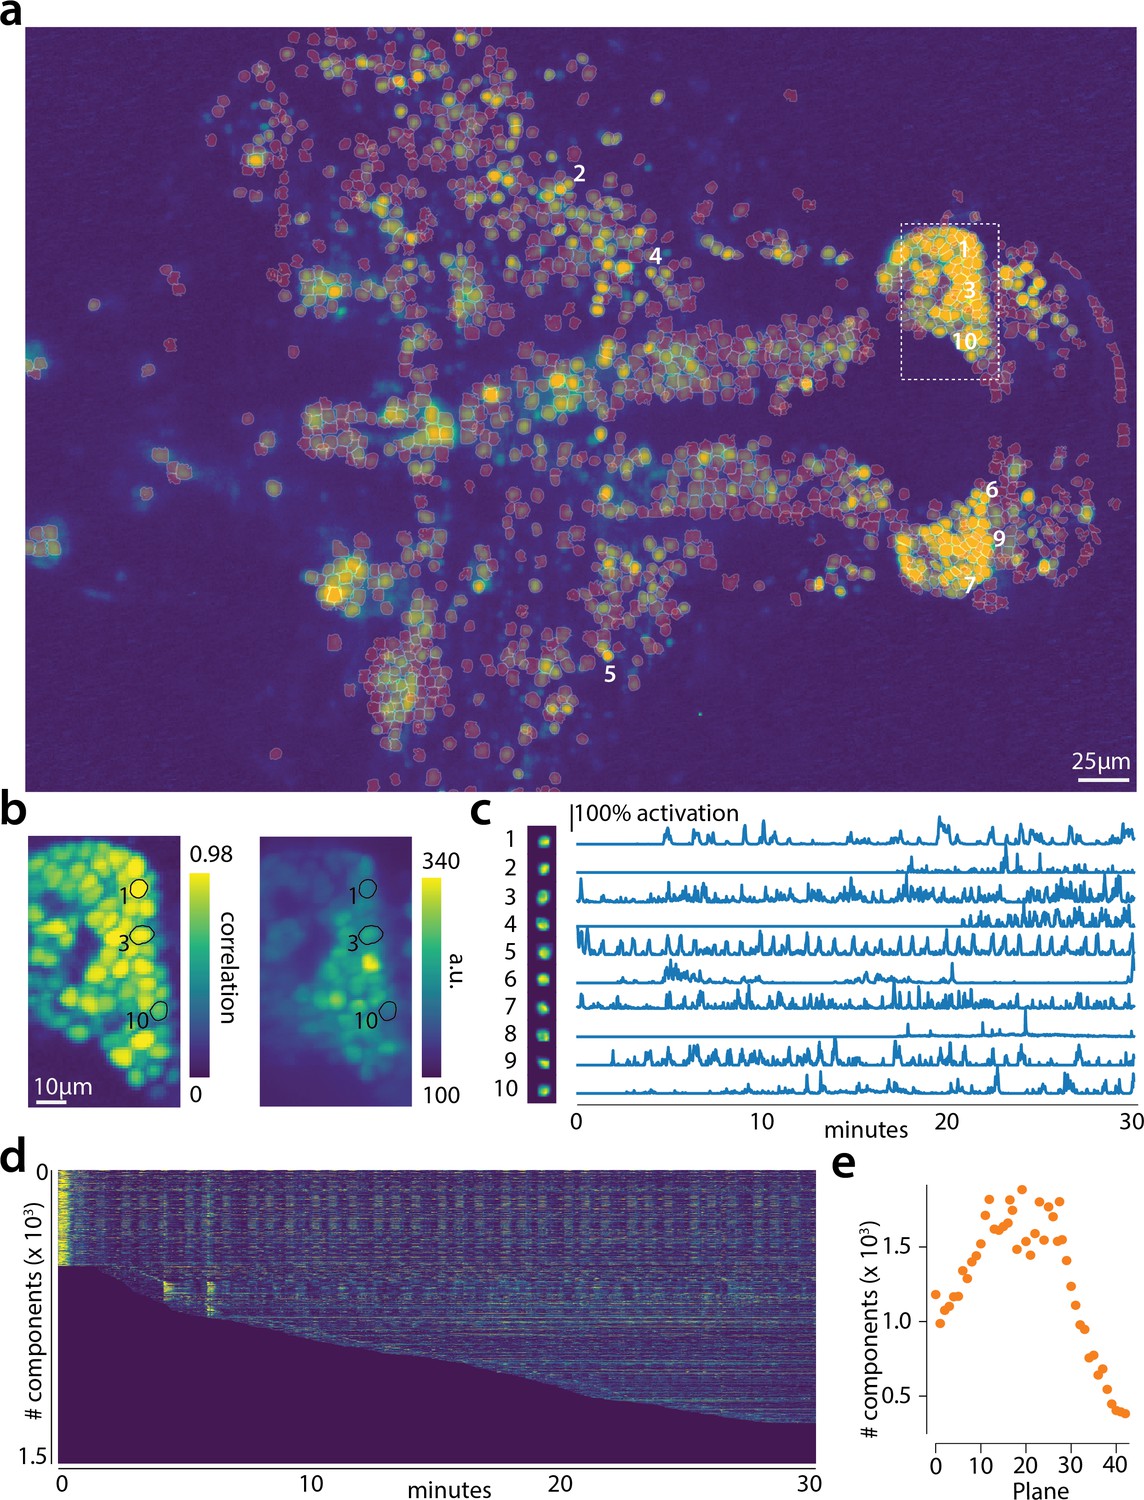
Online analysis of a 30 min long whole brain recording of the zebrafish brain.
(a) Correlation image overlaid with the spatial components (in red) found by the algorithm (portion of plane 11 out of 45 planes in total). (b) Correlation image (left) and mean image (right) for the dashed region in panel (a) with superimposed the contours of the neurons marked in (a). (c) Spatial (left) and temporal (right) components associated to the ten example neurons marked in panel (a). (d) Temporal traces for all the neurons found in the FOV in (a); the initialization on the first 200 frames contained 500 neurons (present since time 0). (e) Number of neurons found per plane (See also Figure 6—figure supplement 1 for a summary of the results from all planes).