
Fig. 5
- ID
- ZDB-IMAGE-190701-22
- Publication
- Stoddard et al., 2019 - Live imaging of leukocyte recruitment in a zebrafish model of chemical liver injury
- All Figures
- Figures for Stoddard et al., 2019
|
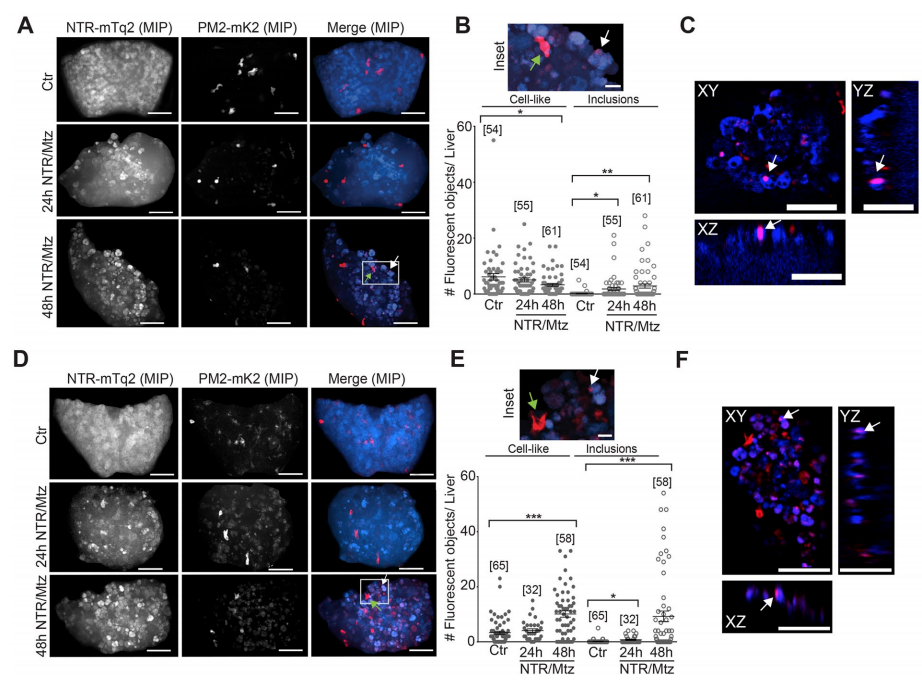
Fig. 5 Neutrophil recruitment after Mtz-induced liver damage. (A) Representative confocal maximum intensity projections (MIP) of zebrafish livers with fluorescent neutrophils after indicated times of Mtz exposure in the lysC neutrophil reporter line. Green arrow, intact neutrophil. White arrow, red fluorescent inclusion. White box marks the inset region. Scale bars, 50 μm. (B) Top: Inset, magnification of marked region in A. Scale bar, 10 μm. Bottom Left: Quantification of lysC neutrophils in the liver at indicated times of Mtz exposure in the lysC:PM2-mK2 reporter line. Bottom Right: Quantification of red fluorescent inclusions in the TG(lysC:PM2-mK2) reporter line. Square brackets, number of animals per condition. Error bars, SEM. *t-test < 0.05. **t-test < 0.005. (C) Orthogonal slice view of TG(lysC:PM2-mK2) larval livers exposed to Mtz for 24 hours. White arrows, red fluorescent inclusions overlapping with hepatocyte. Scale bars, 50 μm. (D) Representative confocal maximum intensity projections (MIP) of zebrafish livers with fluorescent neutrophils after indicated times of Mtz exposure in the TG(mpx:PM2-mK2) reporter line. Green arrow, intact neutrophil. White arrow, red fluorescent inclusions. White box marks the inset region. Scale bars, 50 μm. (E) Top: Magnification of marked region in D. Green arrow, intact neutrophil. White arrow, red fluorescent inclusions. Scale bar, 10 μm. Bottom Left: number of neutrophils in the liver at indicated times of Mtz exposure in the mpx neutrophil reporter line. Bottom Right: number of red fluorescent inclusions in the mpx neutrophil reporter line. Square brackets, number of animals per condition. Error bars, SEM. *t-test p < 0.05. ***t-test p < 0.0005. (F) Orthogonal slice view of lysC neutrophil reporter larvae exposed to Mtz for 48 hours. White arrows, red fluorescent inclusion. Scale bars, 50 μm.