
Fig. 3
- ID
- ZDB-IMAGE-190701-21
- Publication
- Stoddard et al., 2019 - Live imaging of leukocyte recruitment in a zebrafish model of chemical liver injury
- All Figures
- Figures for Stoddard et al., 2019
|
Fig. 3
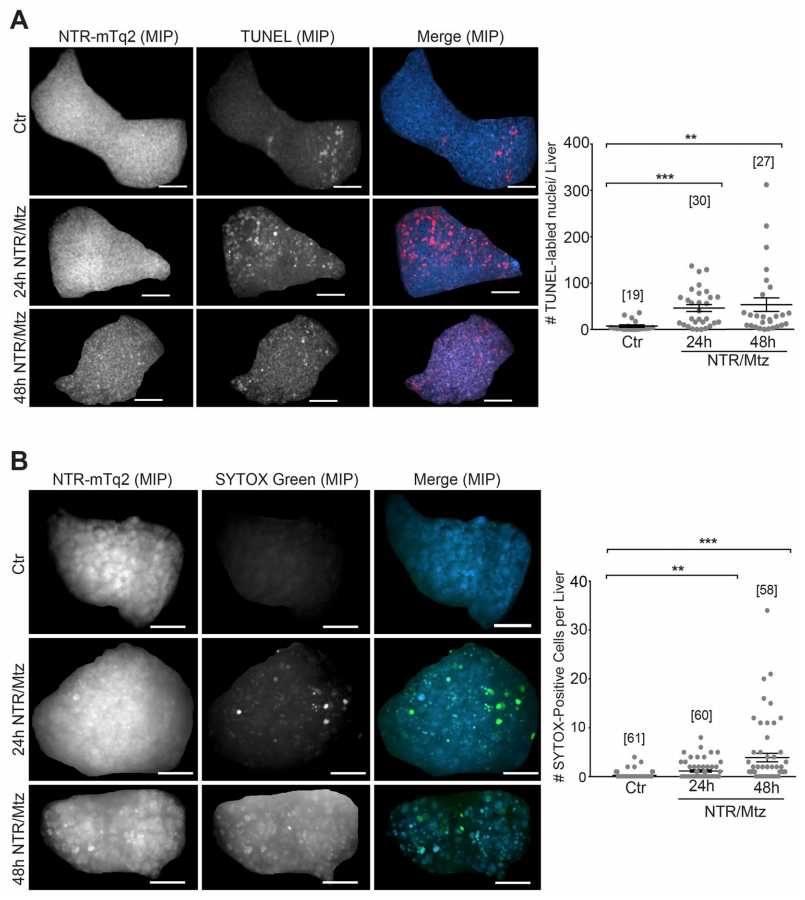
NTR/Mtz primarily induces apoptosis and sporadic necrosis. (A) Left panel: Representative maximum intensity projections (MIP) of zebrafish livers stained for apoptotic DNA (TUNEL) after 24 h and 48 h of Mtz exposure. Cyan, NTR-mTq2. Red, TUNEL labeling. Scale bars, 50 μm. Right panel: Quantification of TUNEL staining. Square brackets, number of animals per condition. Error bars, SEM. **t-test p < 0.005. ***t-test p < 0.0005. (B) Left Panel: Representative confocal maximum intensity projections (MIP) of livers stained for necrotic cells with SYTOX Green after 24 h and 48 h of Mtz exposure. Cyan, NTR-mTq2. Green, SYTOX Green. Scale bars, 50 µm. Right Panel: Quantification of SYTOX Green staining. Square brackets, number of animals per condition. Error bars, SEM. **t-test p < 0.005. ***t-test p < 0.0005.