
Fig. 5
- ID
- ZDB-IMAGE-190701-102
- Publication
- Zhao et al., 2019 - Endocardial Notch Signaling Promotes Cardiomyocyte Proliferation in the Regenerating Zebrafish Heart through Wnt Pathway Antagonism
- All Figures
- Figures for Zhao et al., 2019
|
Fig. 5
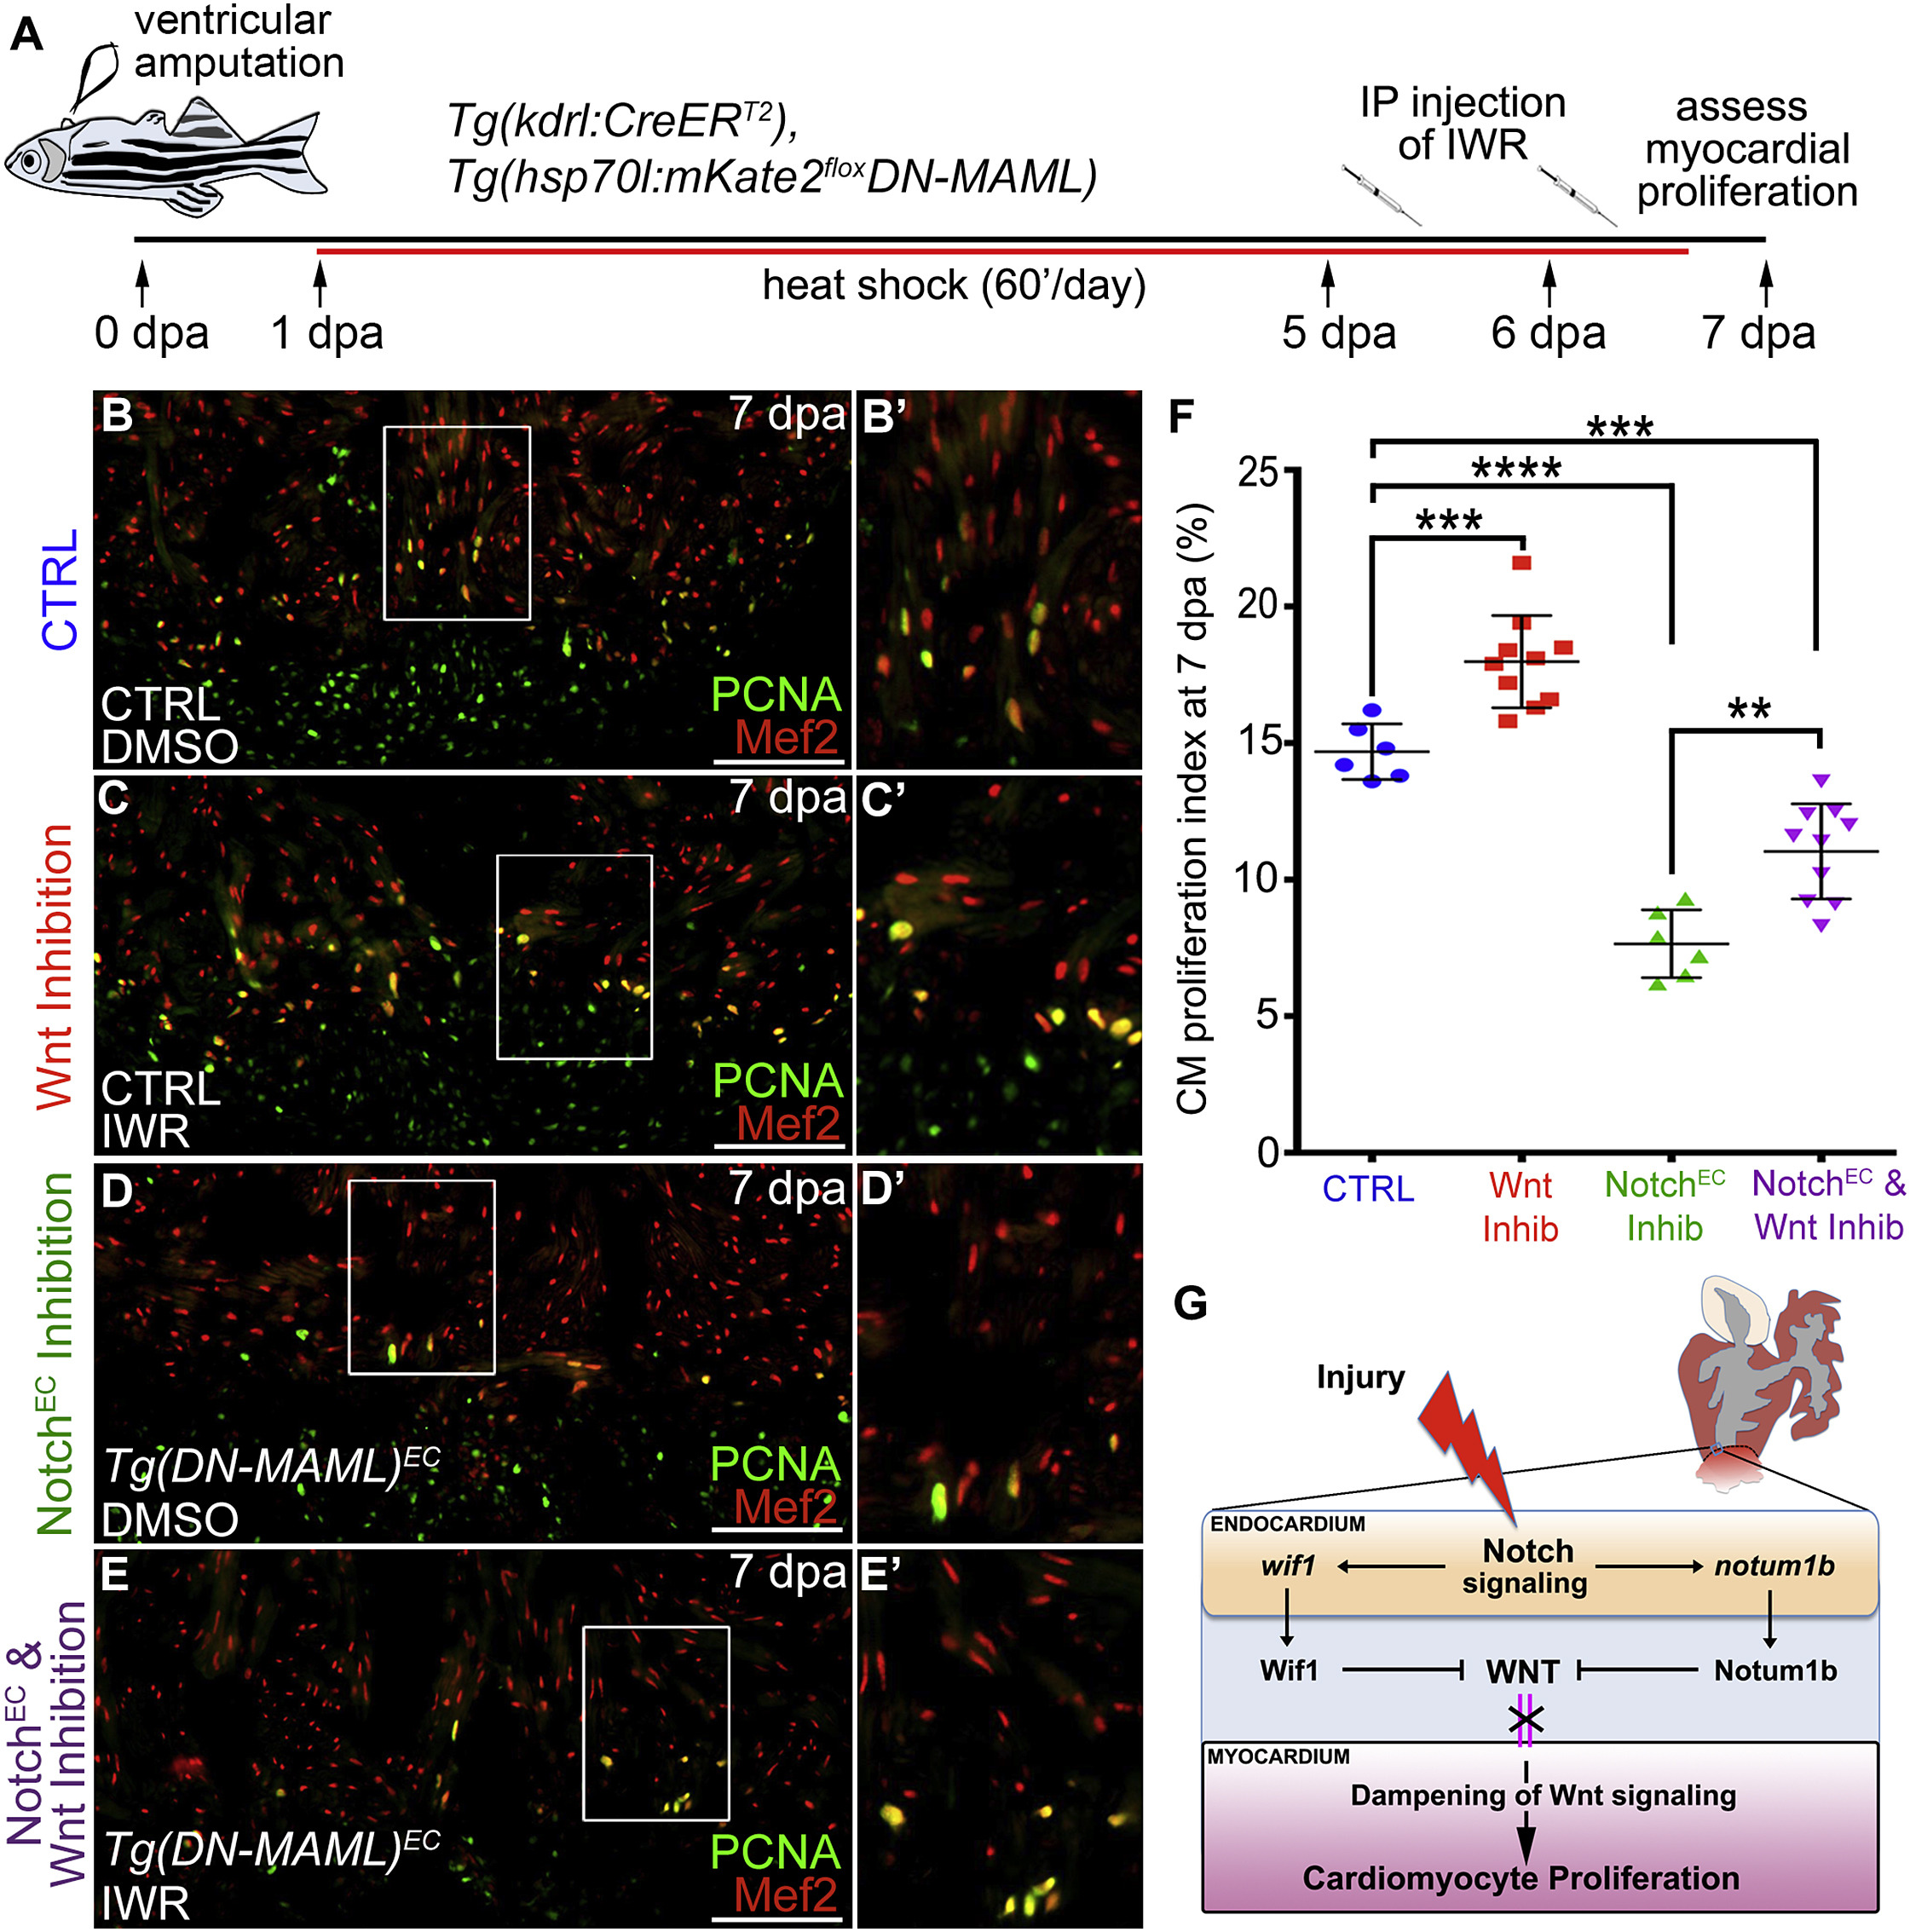
Wnt Inhibition Partially Rescues CardiomyocyteProliferation Deficits Caused by Impaired Endocardial Notch Signaling
(A) Double-transgenic strain and schematic diagram of experimental timeline used to inhibit Wnt signaling in animals with compromised endocardial Notch signaling.
(B–E′) Compound microscopic images of cardiac sections from kdrl:CreERT2, hsp70l:mKate2STOPfloxDN-MAML animals treated during embryogenesis with EtOH (CTRL) (B–C′) or 4-HT (hsp70l:DN-MAMLEC) (D–E′), raised to adulthood, and subjected to ventricular apex amputation. Thereafter, animals were heatshocked daily and treated with DMSO (B, B′, D, and D′) or the Wnt inhibitor IWR-1 (C, C′, E, and E′) before cardiomyocyte proliferation analysis on 7 dpa. Sections were double immunostained to detect cardiomyocyte nuclei (Mef2 antibody; red) and cycling cells (PCNA antibody; green). Boxed regions in (B), (C), (D), and (E) are enlarged in (B′), (C′), (D′), and (E′).
(F) Bar graph showing the cardiomyocyte proliferation indices for the indicated experimental groups (CTRL, n = 6; Wnt Inhib, n = 10; NotchEC Inhib, n = 6; NotchEC and Wnt Inhib, n = 10). 4–6 sections per heart were analyzed and averaged to generate each data point. Statistical significance was determined using a Student’s t test. Error bars: ±1 SD. ∗∗∗p < 0.001. ∗∗∗∗p < 0.0001. ∗∗p < 0.01. Scale bars: 50 μm.
(G) Schematic diagram showing the influence of endocardial Notch on Wnt signaling and cardiomyocyte proliferation.