
Image
|
Figure Caption
Fig. 2-S1
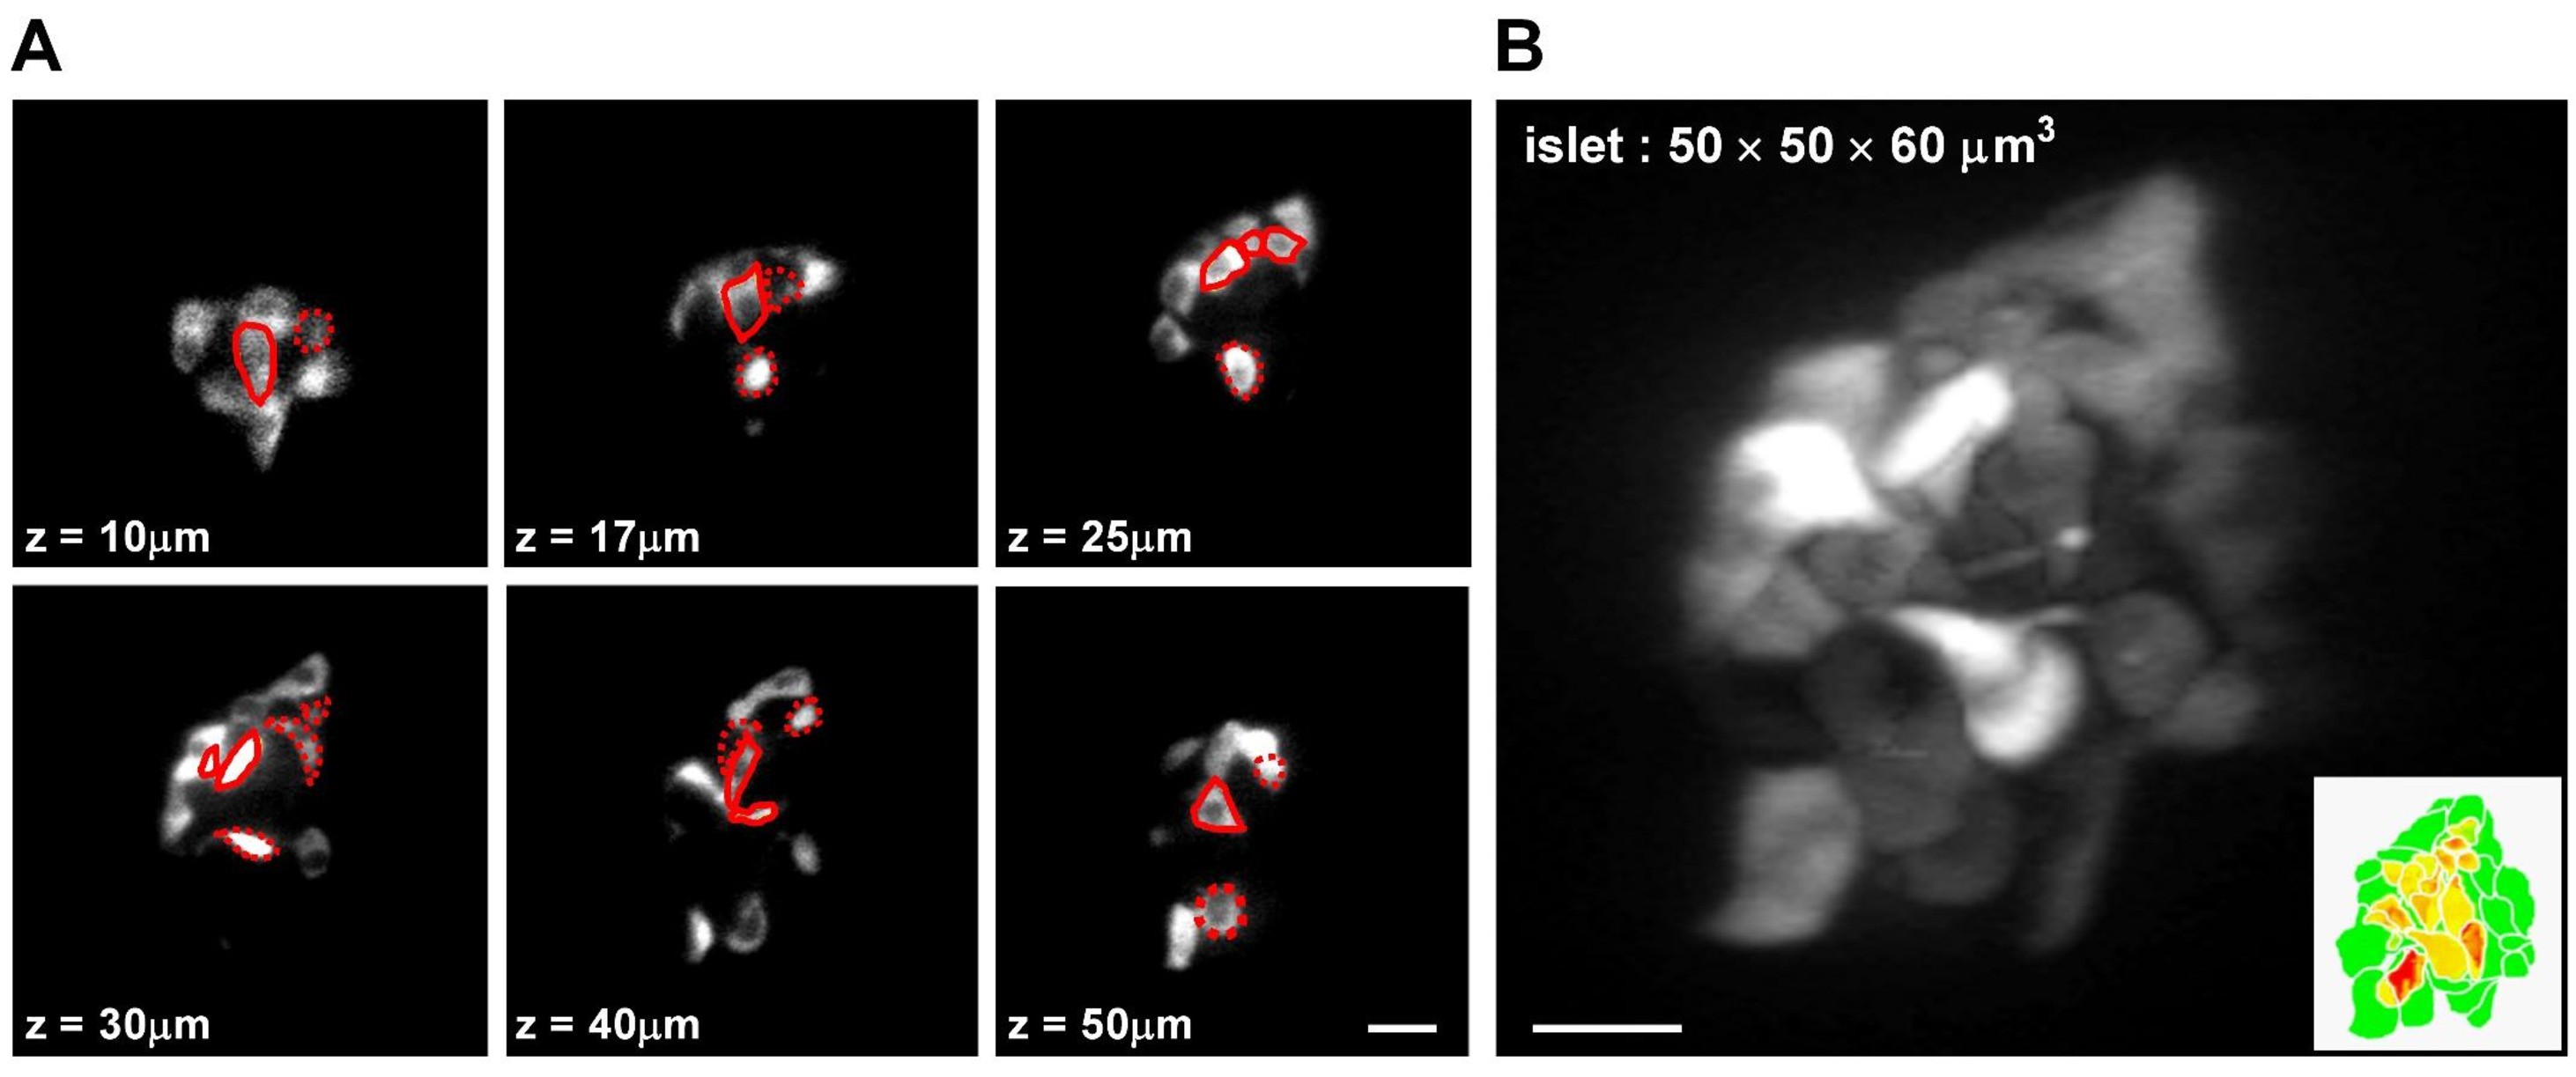
Categorization of β-cells based on their mantle/core localization in the islet.
(A) Representative z-stack images of β-cells in a live Tg (ins:Rcamp1.07) zebrafish embryo at 72 hpf. Red solid circles mark β-cells in the islet core determined in the current focal plane; red dotted circles mark β-cells in the islet core determined in other focal planes. (B) 3D-projection of the islet showed in (A). The inset describes an illustration of β-cells in the mantle (green) and β-cells in the core (yellow to red) of the islet. Scale bars: 10 μm; scale bars apply to (A–B).
Acknowledgments
This image is the copyrighted work of the attributed author or publisher, and
ZFIN has permission only to display this image to its users.
Additional permissions should be obtained from the applicable author or publisher of the image.
Full text @ Elife