
Fig. S7
- ID
- ZDB-IMAGE-190628-53
- Genes
- Publication
- Neal et al., 2019 - Venous identity requires BMP signalling through ALK3
- All Figures
- Figures for Neal et al., 2019
|
Fig. S7
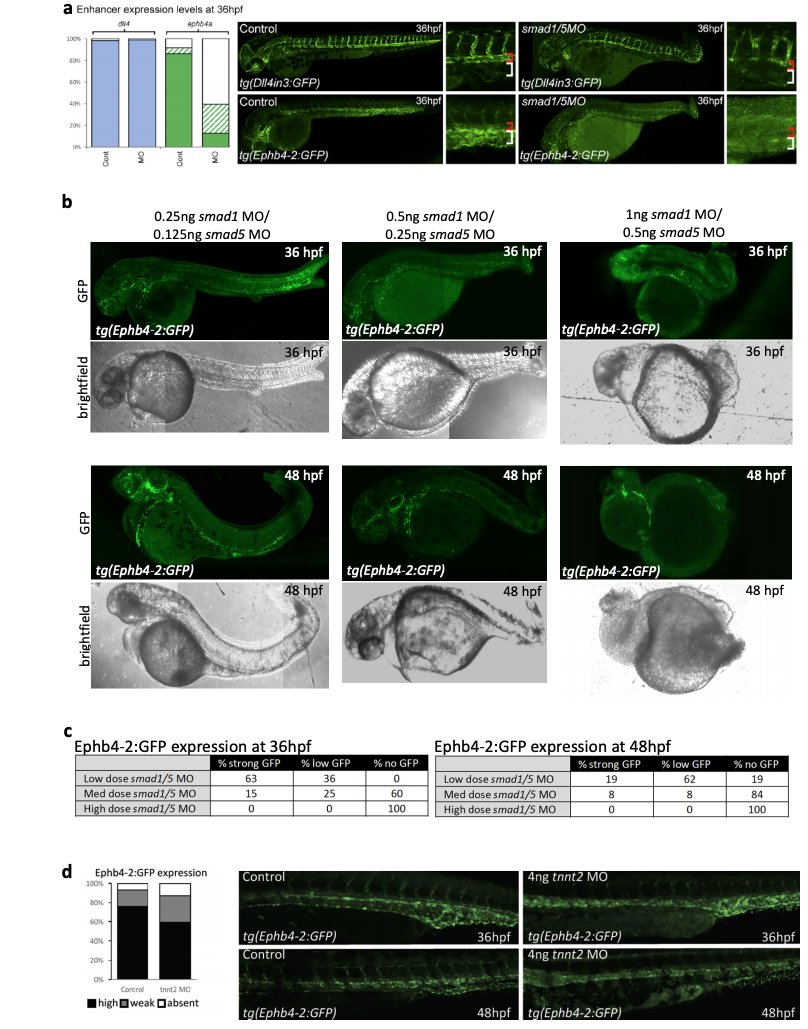
MO-mediated SMAD1/5 knock-down in tg(Ephb4-2:GFP) and tg(Dll4in3:GFP) transgenic zebrafish a. Morpholino (MO)-mediated depletion of smad1/5 in zebrafish lines transgenic for the Dll4in3:GFP arterial and Ephb4-2:GFP venous enhancers at 36hpf. The graphs depict observed expression in all embryos (Dll4in3:GFP WT n=60 MO n=64; Ephb4- 2:GFP WT n=67, MO n=86). High expression levels are represented by solid colour, weak levels by pattern and absent expression by solid white. Zebrafish embryos shown are representative of the predominant phenotype, red bracket=dorsal aorta, white bracket=posterior cardinal and ventral vein(s). b-c. Dose-response analysis of Ephb4-2:GFP expression and morphology using different concentrations of smad1 and smad5 morpholinos. Representative embryos are shown in b, and expression patterns summarized in c. 0.25ng smad1MO/0.125ng smad5MO embryos n=52 at 36hpf, 52 at 48hpf; 0.5ng smad1MO/0.25ng smad5MO embryos n=48 at 36hpf, n=86 at 48hpf; 0.1ng smad1MO/0.5ng smad5MO embryos n=32 at 36hpf, n=49 at 48hpf. d. Expression of Ephb4-2:GFP in zebrafish after loss of blood flow downstream of morpholino-mediated depletion of tnnt2. Graph depicts observed expression pattern of GFP in tg(Ephb4-2:GFP) embryos for control (n=46) and tnnt2-MO injected embryos (n=47), black represents high expression, grey represents weak, white represents absent expression.