
|
Fig. 6
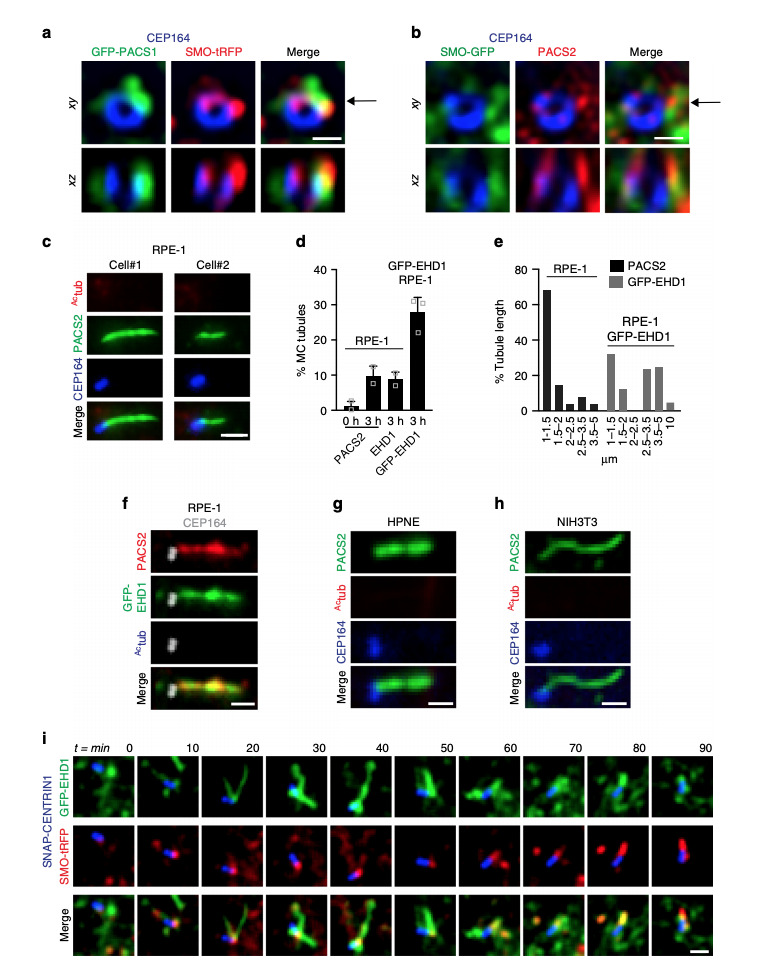
PACSIN and EHD proteins co-localize on dynamic MC-tubules during ciliogenesis. aRepresentative N-SIM images of SMO-tRFP cells transiently expressing GFP-PACSIN1, serum starved for 3 h, and stained with CEP164 antibody. b Representative N-SIM images of SMO-GFP cells serum starved for 3 h and stained with CEP164 and PACSIN2 antibodies. The xz images (bottom panels) in a and b show orthogonal views at the position of the arrow indicated in the xy plane (top panels). Scale bars: 500 nm. c Representative images of RPE-1 cells serum starved for 3 h and stained with CEP164, Actub and PACSIN2 antibodies. Images were taken by epifluorescence microscopy using a 63× objective. Maximum intensity projections of deconvolved z-stacks are shown. d Quantification of PACSIN2, EHD1, or GFP-EHD1-positive MC tubules in RPE-1 cells, serum starved at 0 and 3 h and stained with PACSIN2, EHD1 antibodies, or observed in GFP-EHD1 cells imaged as in c (PACS2 0 h = 79, PACS2 3 h = 140, EHD1 = 67 cells, pooled from n = 2; GFP-EHD1 = 100 cells, pooled from n = 3). Means ± SD. e Graph representing the length of PACSIN2 and GFP-EHD1-positive tubules in cells treated as in (c) (25 tubules per condition). f GFP-EHD1 cells serum starved for 3 h, stained with PACSIN2, Actub (Alexa 305 nm), and CEP164 (Alexa 647) antibodies, and imaged by epifluorescence microscopy using a 63× objective. Z-stack images were deconvolved and a single xy plane is shown. Note the co-localization of PACSIN2 and GFP-EHD1 in MC-associated tubules (25 cells). g, h HPNE (g) and NIH3T3 (h) cells serum starved for 3–6 h and stained with antibodies for PACSIN2, CEP164, and Actub. Images were taken with a 100× objective and are maximum intensity projections of deconvolved z-stacks. i Triple line starved for 3 h, labeled with 300 nM SNAP-Cell647-SiR substrate for the last hour, washed, and imaged live every 10 min. Images are single xy planes (15 cells). Scale bars: 1 μm for (c, f–i)