
Fig. 2
- ID
- ZDB-IMAGE-190627-1
- Genes
- Publication
- Keskin et al., 2019 - Regulatory Network of the Scoliosis-Associated Genes Establishes Rostrocaudal Patterning of Somites in Zebrafish
- All Figures
- Figures for Keskin et al., 2019
|
Fig. 2
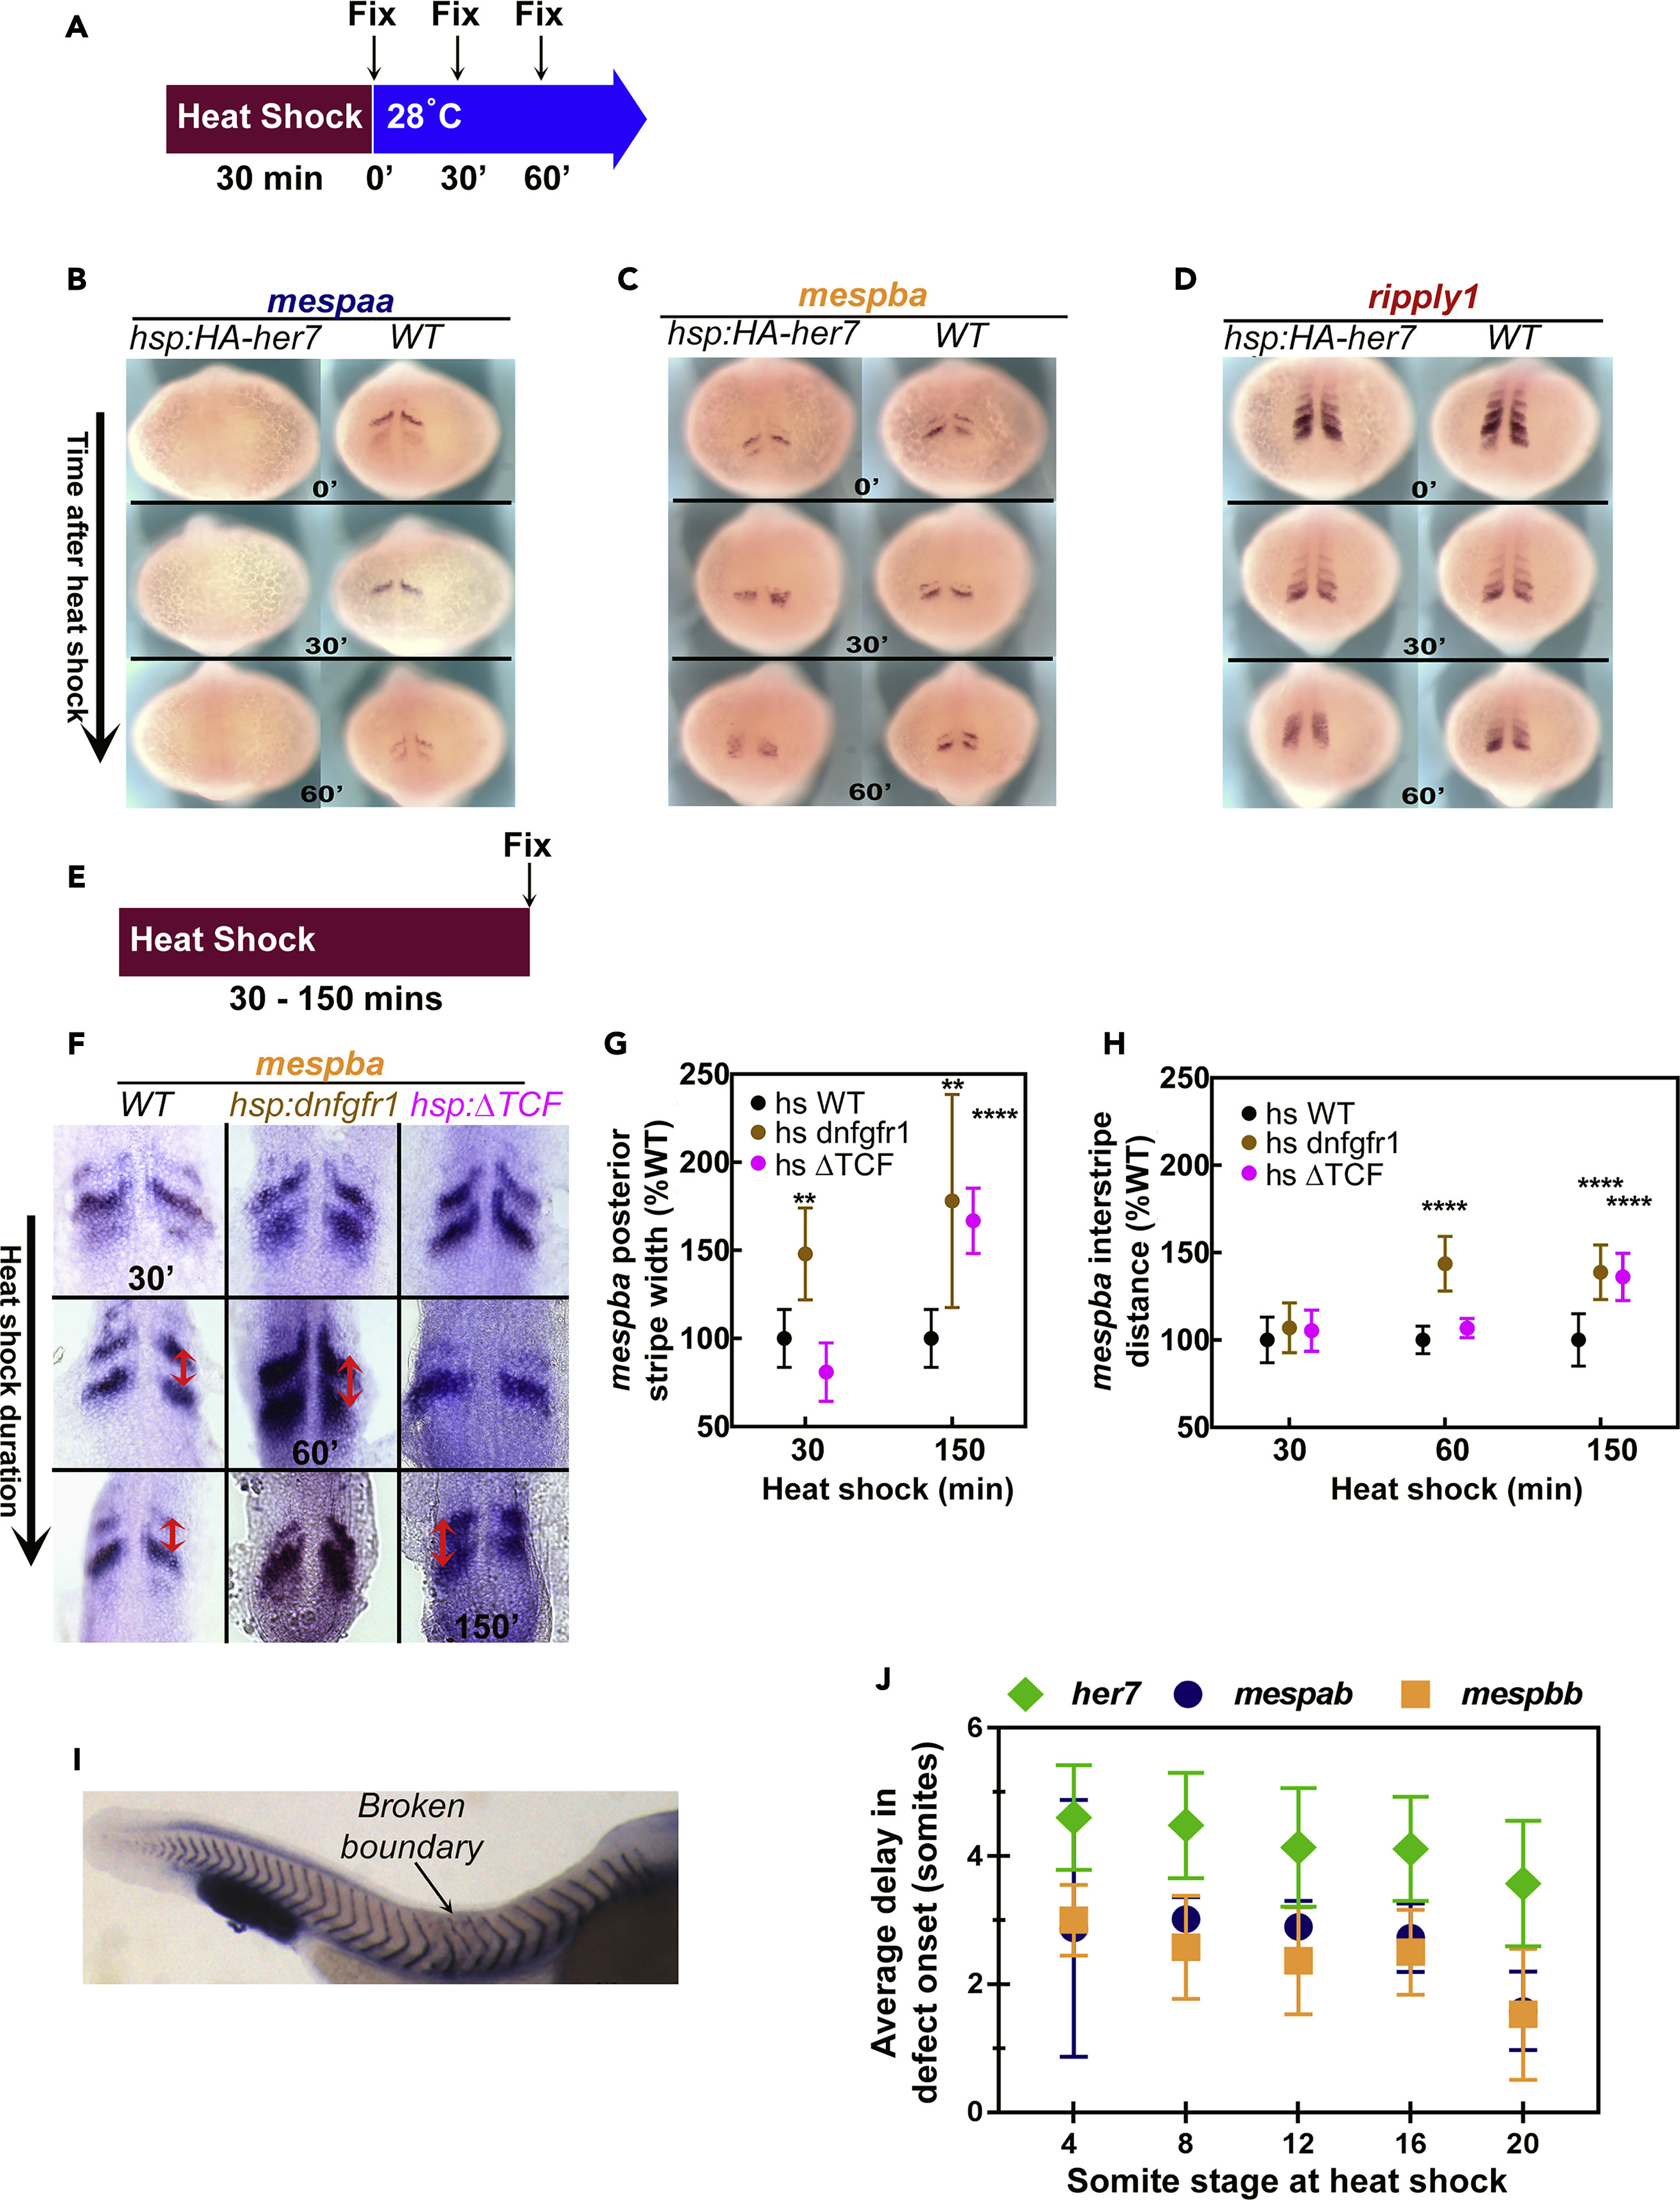
Expression of mesp Genes Read Out the Segmentation Clock Genes and FGF Signaling
(A) Embryos from different genetic backgrounds were fixed immediately or after 30 min, or 60 min of recovery following 30-min heat shock at 37°C.
(B–D) ISH images of mespaa (B), mespba (C), and ripply1 (D) after heat shock of tg(hsp70l:HA-her7) and wild-type (WT) embryos at different recovery time points. This experiment was repeated twice and 43–49 embryos analyzed for all probes and time points.
(E) Embryos from different genetic backgrounds were fixed immediately after 30, 60, 90, 120, or 150 min of heat shock at 37°C.
(F) Flat mounted ISH images of mespba after heat shock of tg(hsp70l:dnfgfr1a-EGFP), tg(hsp70l:tcf7l1a-GFP), and wild-type (WT) embryos at different time points. For each time point 8 to 22 embryos were analyzed. Red arrows show the interstripe distance, which was measured between the anterior ends of stripes.
(G and H) Effect of inhibition of FGF (brown) or Wnt (pink) signaling on the width of the posteriormost stripe of mespba expression stripe (G) and the interstripe distance between two stripes of mespba expression (H) shown as percent of that in wild-type embryos exposed to heat shock. Error bars indicate one standard deviation.
(I) ISH image of xirp2 showing position of the somiteboundary defects in a tg(hsp70l:HA-her7) embryo after 40 min of heat shock. Heat shock started when embryo was at 4-somite stage; first broken boundary appears between 9th and 10th somites as indicated.
(J) Average delay in onset of segmentation defects in embryos overexpressing her7 [tg(hsp70l:HA-her7)], mespab[tg(hsp70l:mespab-myc)], or mespbb [tg(hsp70l:mespbb-myc)] at different somite stages after heat shock at 37°C. her7transgenic embryos were subjected to heat shock for 40 min; mespab and mespbb transgenic embryos were subjected to heat shock for 30 min. Experiments were repeated twice, and 30–62 embryos were analyzed for all genotypes and stages. Error bars indicate one standard deviation.