
Fig. 1
- ID
- ZDB-IMAGE-190618-60
- Publication
- Richardson et al., 2019 - Transcriptome profiling of zebrafish optic fissure fusion
- All Figures
- Figures for Richardson et al., 2019
|
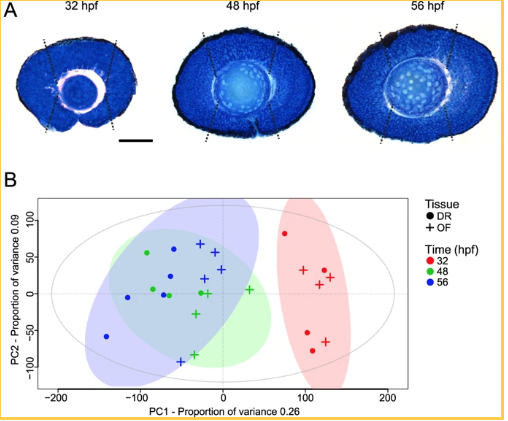
Fig. 1
Optic fissure (OF) and dorsal retina (DR) tissue collection and principle component analysis (PCA). (A) Sagittal section through the zebrafish eye at the level of the lens at 32, 48 and 56 hpf, representative of before, during and after optic fissure fusion. White dotted lines indicate the tissue (inferior is optic fissure and superior is dorsal retina) harvested for RNA-seq transcriptome analysis. Scale bar 50 µm. (B) PCA of RNA-seq transcriptome data expression patterns using regularized-logarithm transformed count data in DESeq2. Time (hours post fertilization, hpf) is represented by colour and origin of tissue by shape.